Simulate expected yield using below slot limit regulations using the Beverton-Holt Yield-per-Recruit model
Source:R/yprBH_SlotLL.R
yprBH_SlotLL.RdSimulate yield below slot length regulations using the Beverton-Holt Yield-per-Recruit (YPR) model with (possibly) multiple values for conditional natural mortality (cm) and chosen values for the lower and upper lengths of the slot (i.e,. lowerSL and upperSL); conditional fishing mortality below (cfBelow), in (cfIn), and above (cfAbove) the slot; and length when fish recruit to the fishery (recruitmentTL).
Usage
yprBH_SlotLL(
  lowerSL,
  upperSL,
  cfBelow,
  cfIn,
  cfAbove,
  cm,
  lhparms,
  recruitmentTL = NULL,
  loi = NULL,
  matchRicker = FALSE,
  label = NULL
)
Arguments
- lowerSL
A single numeric representing the length of the lower slot limit in mm. See details. Must be less than
upperSL.- upperSL
A single numeric representing the length of the upper slot limit in mm. See details. Must be less than
Linfinlhparms.- cfBelow
A single numeric representing conditional fishing mortality below the lower slot limit length. Must be between 0 and 1 (inclusive).
- cfIn
A single numeric representing conditional fishing mortality between the lower and upper slot limit lengths (i.e., "in the slot"). Must be between 0 and 1 (inclusive).
- cfAbove
A single numeric representing conditional fishing mortality above the upper slot limit length. Must be between 0 and 1 (inclusive).
- cm
A numeric vector of conditional natural mortality values. All values must be between 0 and 1 (inclusive).
- lhparms
A named vector or list that contains values for each
N0,tmax,Linf,K,t0,LWalpha, andLWbeta. SeemakeLHfor definitions of these life history parameters. Also see details.- recruitmentTL
A single numeric that represents the minimum length (in mm) for recruiting to the fishery. Cannot be greater than
lowerSL.- loi
A numeric vector of lengths (in mm) of interest. Used to determine number of fish that reach these lengths. All must be less than
Linfinlhparms.- matchRicker
A logical that indicates whether the yield function should match that in Ricker (1975). Defaults to
TRUE. The only reason to changed toFALSEis to try to match output from FAMS. See the FAMS vs Ricker article.- label
An optional string to label the type of slot limit being simulated.
Value
A data.frame with the following calculated values:
yieldTotalis the calculated total yieldyieldBelowis the calculated yield below the slot limityieldInis the calculated yield within the slot limityieldAboveis the calculated yield above the slot limitnharvTotalis the calculated total number of harvested fishndieTotalis the calculated total number of fish that die of natural deathnharvestBelowis the number of harvested fish below the slot limitnharvestInis the number of harvested fish within the slot limitnharvestAboveis the number of harvested fish above the slot limitn0dieis the number of fish that die of natural death before entering the fishery at a minimum lengthndieBelowis the number of fish that die of natural death between entering the fishery and the lower slot limitndieInis the number of fish that die of natural deaths within the slot limitndieAboveis the number of fish that die of natural deaths above the slot limitnrBelowis the number of fish at time trBelow (time they become harvestable size below the slot limit)nrInis the number of fish at time trIn (time they reach the lower slot limit size)nrAboveis the number of fish at time trAbove (time they reach the upper slot limit size)trBelowis the time for a fish to recruit to a minimum length limit (i.e., time to enter fishery)trInis the time for a fish to recruit to a lower length limit of the slot limittrOveris the time for a fish to recruit to a upper length limit of the slot limitavglenBelowis the average length of fish harvested below the slot limitavglenInis the average length of fish harvested within the slot limitavglenAboveis the average length of fish harvested above the slot limitavgwtBelowis the average weight of fish harvested below the slot limitavgwtInis the average weight of fish harvested within the slot limitavgwtAboveis the average weight of fish harvested above the slot limitnAtxxxis the number that reach the length of interest supplied. There will be one column for each length of interest.cmA numeric representing conditional natural mortalityexpBelowis the exploitation rate below the slot limitexpInis the exploitation rate within the slot limitexpAboveis the exploitation rate above the slot limitFBelowis the estimated instantaneous rate of fishing mortality below the slot limitFInis the estimated instantaneous rate of fishing mortality within the slot limitFAboveis the estimated instantaneous rate of fishing mortality above the slot limitMBelowis the estimated instantaneous rate of natural mortality below the slot limitMInis the estimated instantaneous rate of natural mortality within the slot limitMAboveis the estimated instantaneous rate of natural mortality above the slot limitZBelowis the estimated instantaneous rate of total mortality below the slot limitZInis the estimated instantaneous rate of total mortality within the slot limitZAboveis the estimated instantaneous rate of total mortality above the slot limitSBelowis the estimated total survival below the slot limitSInis the estimated total survival within the slot limitSAboveis the estimated total survival above the slot limit
For convenience the data.frame also contains the model input values (lowerSL, upperSL, cfBelow, cfIn, cfOver, cm from input vectors; N0; Linf; K; t0; LWalpha; LWbeta; and tmax from lhparms) and, optionally, the string provided in label.
Details
Details will be filled out later.
Note that the main calculations are in the internal yprBH_slot_func (use rFAMS:::yprBH_slot_func to see that source code).
See also
yprBH_MinLL for estimating yield with the yield-per-recruit model using a minimum length limits, or dpmBH_MinLL for estimating yield with a dynamic pool model using a minimum length limit.
See this demonstration page for more examples of this function.
Author
Jason C. Doll, jason.doll@fmarion.edu
Examples
#Load other required packages for organizing output and plotting
library(ggplot2) #for plotting
library(dplyr) #for select
library(tidyr) #for pivot_longer
# Life history parameters to be used below
LH <- makeLH(N0=100,tmax=15,Linf=592,K=0.20,t0=-0.3,LWalpha=-5.528,LWbeta=3.273)
# conditional natural mortality vector
cm <- seq(from = 0.1, to = 0.9, by = 0.1)
# Estimate yield based on a protected slot limit
Res_1 <- yprBH_SlotLL(lowerSL=250,upperSL=325,
cfBelow=0.25,cfIn=0.0,cfAbove=0.15,cm=cm,
lhparms=LH,recruitmentTL=200,
loi=c(200,250,300,325,350),label="250-325")
Res_1
#> yieldTotal yieldBelow yieldIn yieldAbove nharvTotal ndieTotal
#> 1 46197.75428 2134.02263 0 44063.731657 46.4972295 33.877878
#> 2 19470.46525 1661.31736 0 17809.147884 26.2230471 40.820004
#> 3 8398.37800 1251.53890 0 7146.839100 15.3741194 37.919849
#> 4 3685.37197 903.25539 0 2782.116585 9.1781028 31.485803
#> 5 1625.61154 614.90035 0 1010.711189 5.4378755 24.061504
#> 6 707.41176 384.73474 0 322.677013 3.0898650 16.823205
#> 7 292.44938 210.78782 0 81.661558 1.5937619 10.403811
#> 8 103.91797 90.75603 0 13.161937 0.6667805 5.207535
#> 9 22.48605 21.80087 0 0.685181 0.1607166 1.572193
#> nharvestBelow nharvestIn nharvestAbove n0die ndieBelow ndieIn
#> 1 14.3001921 0 32.197037424 16.93639 5.237294 7.7673445
#> 2 11.1865599 0 15.036487211 32.49751 8.676970 11.4974691
#> 3 8.4736976 0 6.900421751 46.64404 10.505888 12.2698331
#> 4 6.1545044 0 3.023598400 59.32995 10.928309 11.0537921
#> 5 4.2212588 0 1.216616732 70.50022 10.170789 8.7018157
#> 6 2.6654563 0 0.424408716 80.08692 8.489694 5.9406702
#> 7 1.4775667 0 0.116195279 88.00243 6.183736 3.3592771
#> 8 0.6466386 0 0.020141855 94.12568 3.617621 1.3904478
#> 9 0.1595880 0 0.001128596 98.26709 1.277330 0.2788736
#> ndieAbove nrBelow nrIn nrAbove trBelow trIn trOver
#> 1 20.87323905 83.063612 63.5261255 55.75878105 1.761224 2.443479 3.68129
#> 2 20.64556520 67.502485 47.6389553 36.14148621 1.761224 2.443479 3.68129
#> 3 15.14412843 53.355962 34.3763764 22.10654334 1.761224 2.443479 3.68129
#> 4 9.50370239 40.670046 23.5872325 12.53344041 1.761224 2.443479 3.68129
#> 5 5.18889991 29.499778 15.1077308 6.40591513 1.761224 2.443479 3.68129
#> 6 2.39283987 19.913084 8.7579328 2.81726260 1.761224 2.443479 3.68129
#> 7 0.86079792 11.997573 4.3362705 0.97699339 1.761224 2.443479 3.68129
#> 8 0.19946640 5.874316 1.6100560 0.21960825 1.761224 2.443479 3.68129
#> 9 0.01599007 1.732910 0.2959923 0.01711867 1.761224 2.443479 3.68129
#> avglenBelow avglenIn avglenAbove avgwtBelow avgwtIn avgwtAbove nAt200
#> 1 225.5013 0 443.8067 149.2303 0 1368.5648 83.063612
#> 2 225.1683 0 424.6353 148.5101 0 1184.3955 67.502485
#> 3 224.7908 0 407.5833 147.6969 0 1035.7105 53.355962
#> 4 224.3558 0 393.1118 146.7633 0 920.1343 40.670046
#> 5 223.8426 0 381.0284 145.6675 0 830.7556 29.499778
#> 6 223.2179 0 370.8494 144.3410 0 760.2978 19.913084
#> 7 222.4198 0 362.0448 142.6588 0 702.7958 11.997573
#> 8 221.3140 0 354.0829 140.3505 0 653.4620 5.874316
#> 9 219.4936 0 346.2120 136.6072 0 607.1089 1.732910
#> nAt250 nAt300 nAt325 nAt350 cm expBelow expIn expAbove
#> 1 63.5261255 58.45086262 55.75878105 48.8794721 0.1 0.2378792 0 0.14257140
#> 2 47.6389553 39.93702691 36.14148621 29.9002613 0.2 0.2252683 0 0.13484863
#> 3 34.3763764 25.93244414 22.10654334 17.1270909 0.3 0.2120703 0 0.12677377
#> 4 23.5872325 15.75263905 12.53344041 9.0017108 0.4 0.1981511 0 0.11826676
#> 5 15.1077308 8.73574294 6.40591513 4.2064335 0.5 0.1833156 0 0.10921127
#> 6 8.7579328 4.24537168 2.81726260 1.6577675 0.6 0.1672608 0 0.09942671
#> 7 4.3362705 1.67453146 0.97699339 0.4990840 0.7 0.1494673 0 0.08860398
#> 8 1.6100560 0.45129000 0.21960825 0.0919120 0.8 0.1288953 0 0.07612528
#> 9 0.2959923 0.04797287 0.01711867 0.0050959 0.9 0.1027330 0 0.06032395
#> FBelow FIn FAbove MBelow MIn MAbove ZBelow ZIn
#> 1 0.2876821 0 0.1625189 0.1053605 0.1053605 0.1053605 0.3930426 0.1053605
#> 2 0.2876821 0 0.1625189 0.2231436 0.2231436 0.2231436 0.5108256 0.2231436
#> 3 0.2876821 0 0.1625189 0.3566749 0.3566749 0.3566749 0.6443570 0.3566749
#> 4 0.2876821 0 0.1625189 0.5108256 0.5108256 0.5108256 0.7985077 0.5108256
#> 5 0.2876821 0 0.1625189 0.6931472 0.6931472 0.6931472 0.9808293 0.6931472
#> 6 0.2876821 0 0.1625189 0.9162907 0.9162907 0.9162907 1.2039728 0.9162907
#> 7 0.2876821 0 0.1625189 1.2039728 1.2039728 1.2039728 1.4916549 1.2039728
#> 8 0.2876821 0 0.1625189 1.6094379 1.6094379 1.6094379 1.8971200 1.6094379
#> 9 0.2876821 0 0.1625189 2.3025851 2.3025851 2.3025851 2.5902672 2.3025851
#> ZAbove SBelow SIn SAbove cfBelow cfIn cfOver recruitmentTL lowerSL upperSL
#> 1 0.2678794 0.675 0.9 0.765 0.25 0 0.15 200 250 325
#> 2 0.3856625 0.600 0.8 0.680 0.25 0 0.15 200 250 325
#> 3 0.5191939 0.525 0.7 0.595 0.25 0 0.15 200 250 325
#> 4 0.6733446 0.450 0.6 0.510 0.25 0 0.15 200 250 325
#> 5 0.8556661 0.375 0.5 0.425 0.25 0 0.15 200 250 325
#> 6 1.0788097 0.300 0.4 0.340 0.25 0 0.15 200 250 325
#> 7 1.3664917 0.225 0.3 0.255 0.25 0 0.15 200 250 325
#> 8 1.7719568 0.150 0.2 0.170 0.25 0 0.15 200 250 325
#> 9 2.4651040 0.075 0.1 0.085 0.25 0 0.15 200 250 325
#> N0 Linf K t0 LWalpha LWbeta tmax label
#> 1 100 592 0.2 -0.3 -5.528 3.273 15 250-325
#> 2 100 592 0.2 -0.3 -5.528 3.273 15 250-325
#> 3 100 592 0.2 -0.3 -5.528 3.273 15 250-325
#> 4 100 592 0.2 -0.3 -5.528 3.273 15 250-325
#> 5 100 592 0.2 -0.3 -5.528 3.273 15 250-325
#> 6 100 592 0.2 -0.3 -5.528 3.273 15 250-325
#> 7 100 592 0.2 -0.3 -5.528 3.273 15 250-325
#> 8 100 592 0.2 -0.3 -5.528 3.273 15 250-325
#> 9 100 592 0.2 -0.3 -5.528 3.273 15 250-325
# Plot results
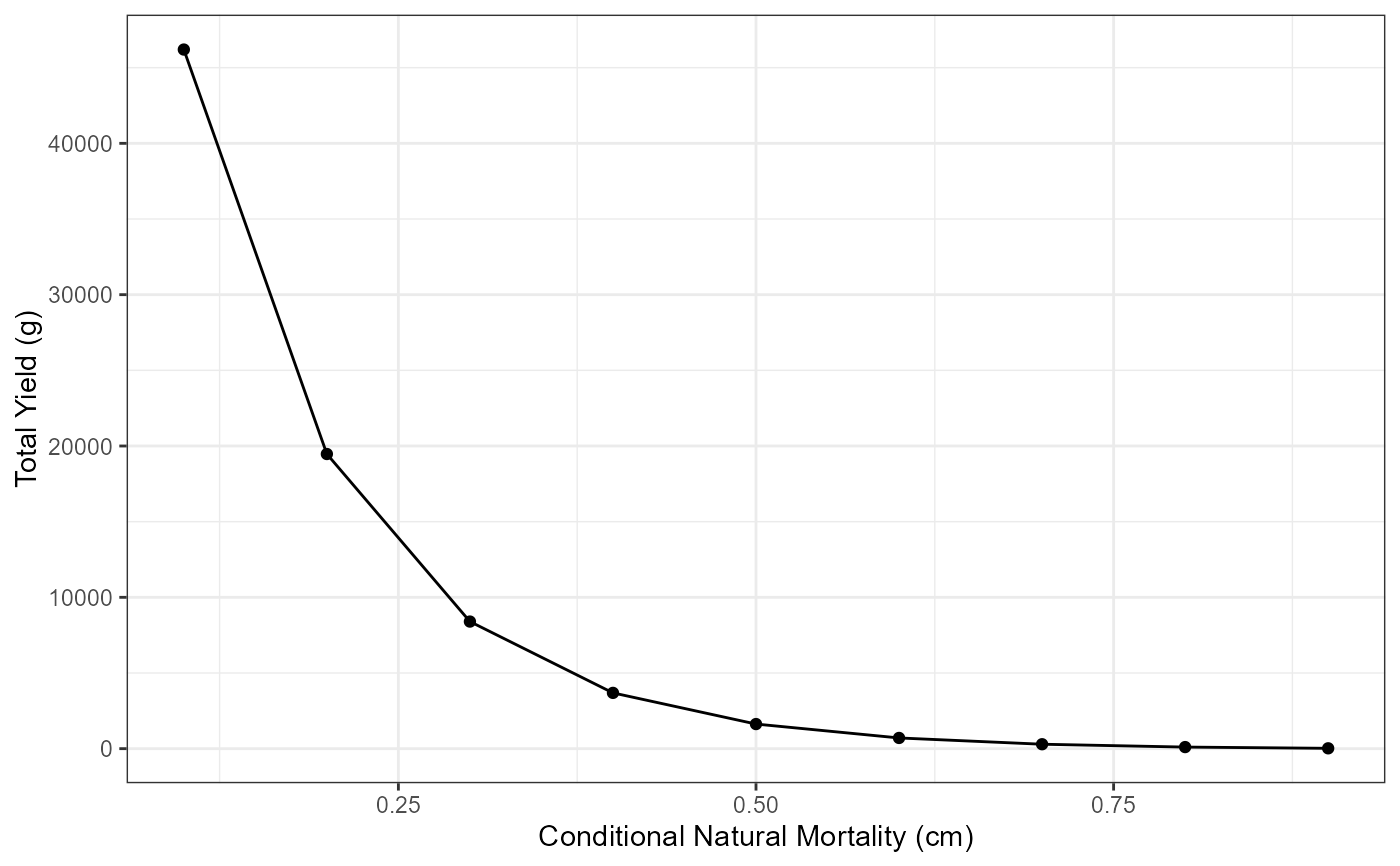
# Total Yield vs Conditional Natural Mortality (cm)
ggplot(data=Res_1,mapping=aes(x=cm,y=yieldTotal)) +
geom_point() +
geom_line() +
labs(y="Total Yield (g)",x="Conditional Natural Mortality (cm)") +
theme_bw()
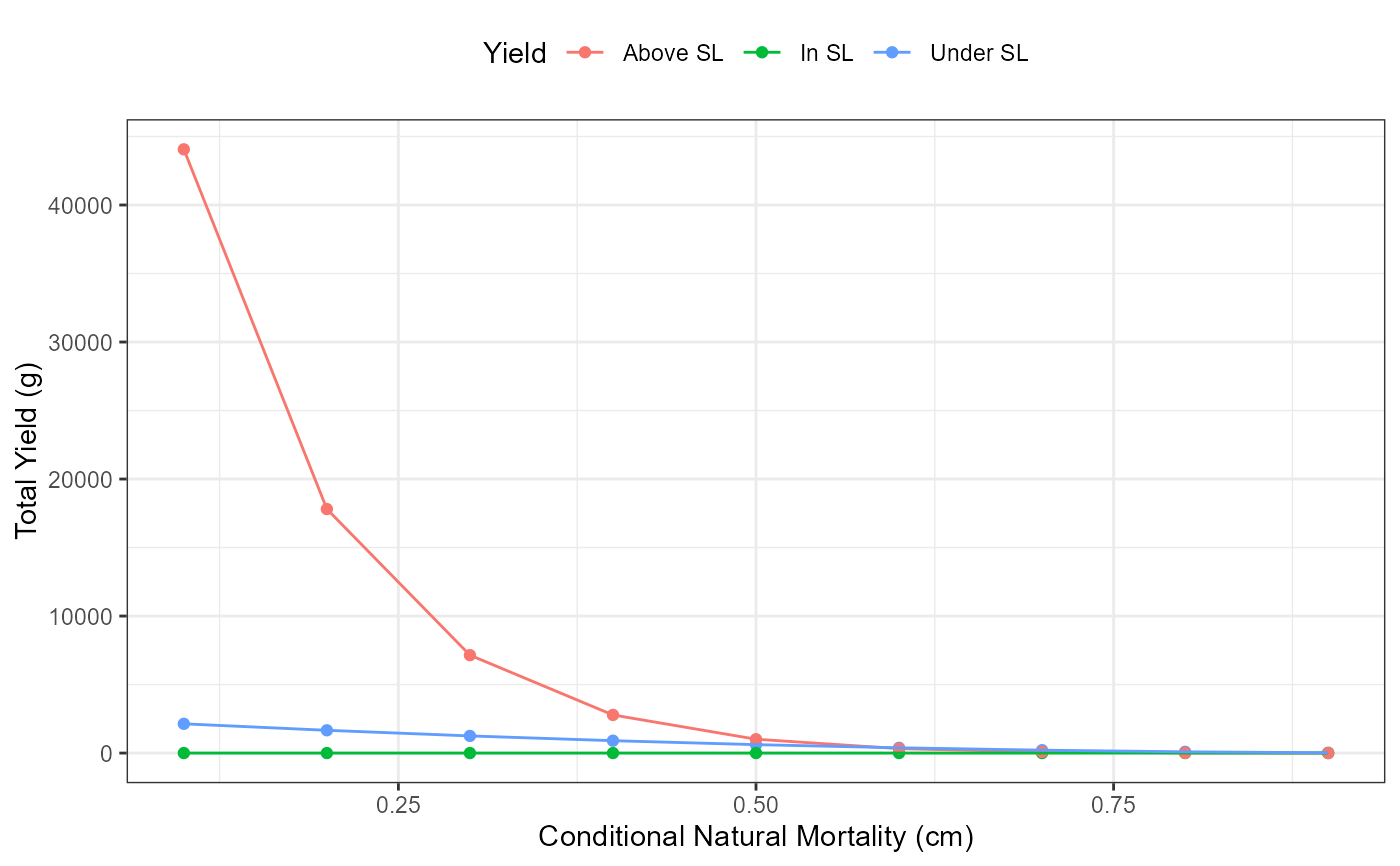
 # Yield below, in, and above the slot limit vs Conditional Natural Mortality (cm)
# Select columns for plotting
plot_data <- Res_1 |>
select(cm, yieldBelow, yieldIn, yieldAbove) |>
pivot_longer(!cm, names_to="YieldCat",values_to="Yield")
# Generate plot
ggplot(data=plot_data,mapping=aes(x=cm,y=Yield,group=YieldCat,color=YieldCat)) +
geom_point() +
scale_color_discrete(name="Yield",labels=c("Above SL","In SL","Below SL"))+
geom_line() +
labs(y="Total Yield (g)",x="Conditional Natural Mortality (cm)") +
theme_bw() +
theme(legend.position = "top")+
guides(color=guide_legend(title="Yield"))
# Yield below, in, and above the slot limit vs Conditional Natural Mortality (cm)
# Select columns for plotting
plot_data <- Res_1 |>
select(cm, yieldBelow, yieldIn, yieldAbove) |>
pivot_longer(!cm, names_to="YieldCat",values_to="Yield")
# Generate plot
ggplot(data=plot_data,mapping=aes(x=cm,y=Yield,group=YieldCat,color=YieldCat)) +
geom_point() +
scale_color_discrete(name="Yield",labels=c("Above SL","In SL","Below SL"))+
geom_line() +
labs(y="Total Yield (g)",x="Conditional Natural Mortality (cm)") +
theme_bw() +
theme(legend.position = "top")+
guides(color=guide_legend(title="Yield"))