Simulate expected yield under minimum length regulations using the Dynamic Pool model for a range of input parameters
Source:R/dpmBH_MinLL.R
dpmBH_MinLL.RdSimulate yield under minimum length regulations using the Dynamic Pool (DPM) model with (possibly) multiple values for conditional fishing mortality (cf) and conditional natural mortality (cm).
Usage
dpmBH_MinLL(
  minLL,
  cf,
  cm,
  rec,
  lhparms,
  simyears,
  species = NULL,
  group = NULL,
  matchRicker = FALSE
)
Arguments
- minLL
A single numeric representing the minimum length limit for harvest in mm.
- cf
A matrix of conditional fishing mortality where each row represents a year and each column represents an age (age-0 through maximum age; i.e.,
tmaxinlhparms). All values must be between 0 and 1 (inclusive).- cm
A matrix of conditional natural mortality where each row represents a year and each column represents an age (age-0 through maximum age; i.e.,
tmaxinlhparms). All values must be between 0 and 1 (inclusive).- rec
A numeric vector with length
simyearsthat specifies the number of recruits each year. This vector is best generated using thegenRecruits. All values must be greater than 0.- lhparms
A named vector or list that contains values for each
N0,tmax,Linf,K,t0,LWalpha, andLWbeta. SeemakeLHfor definitions of these life history parameters. Also see details.- simyears
A single numeric for the number of years to simulate. Value must be a whole number greater than 1.
- species
A single character to specify the species used in the simulation. This will define the length for
stock,quality,preferred,memorable, andtrophylengths from the FSA package. See thePSDlitdocumentation.- group
A single character to specify the sub-group name for
specieswhich may be required when defining thestock,quality,preferred,memorable, andtrophylength categories from the FSA package. See thePSDlitdocumentation.- matchRicker
A logical that indicates whether the yield function should match that in Ricker (1975). Defaults to
FALSE. See the FAMS vs Ricker article.
Value
A list with two data.frame object. The first list item named sumbyAge contains a data.frame with the following calculated values in a summary by age:
yearis the year number for the simulationycis the year class number for the simulationageis the age of fish from the year classlengthis the length-at-age at the beginning of the year based on parameters supplied for the von Bertlanffy growth model.weightis the total weight at the beginning of the year for length-at-age based on the parameters supplied for the weight-length model.N_startis the number of fish alive at the start of the year for the given age and year class.exploitationis the exploitation rate at age based on the supplied conditional fishing mortality rate.expect_nat_deathis the expectation of natural death based on the supplied conditional natural mortality rate.cfis the supplied conditional fishing mortality rate.cmis the supplied conditional natural mortality rate.Fis the instantaneous rate of fishing mortality.Mis the instantaneous rate of natural mortality.Zis the instantaneous rate of total mortality.Sis the (total) annual rate of survival.biomassis the total biomass of fish at age and year.N_harvestis the total number of fish harvested at age and year.N_dieis the total number of fish that die at age and year.yieldis the estimated yield (in g).minLLis the minimum length limit specified in the simulation.
For convenience the data.frame also contains the model input values (N0, Linf, K, t0, LWalpha, LWbeta, and tmax).
The second list item named sumbyYear contains a data.frame with the following calculated values in a summary by year:
yearis the year number for the simulationAge_1plusis the total number of fish age-1 plus per year.Yield_Age_1plusis the total year of age-1 plus fish per year.Total_biomassis the total biomass of age-1 plus fish per year.N_harvest_Age_1plusis the number of age-1 plus fish that are harvested per year.N_die_Age_1plusis the number of age-1 plus fish that die per year.substockis the number of substock sized fish at age and year at the beginning of the year.stockis the number of stock sized fish at age and year at the beginning of the year.qualityis the number of quality sized fish at age and year at the beginning of the year.preferredis the number of preferred sized fish at age and year at the beginning of the year.memorableis the number of memorable sized fish at age and year at the beginning of the year.trophyis the number of trophy sized fish at age and year at the beginning of the year.PSDis the number of quality sized fish divided by the number of stock sized multiplied by 100.PSD_Pis the number of preferred sized fish divided by the number of stock sized multiplied by 100.PSD_Mis the number of memorable sized fish divided by the number of stock sized multiplied by 100.PSD_Tis the number of trophy sized fish divided by the number of stock sized multiplied by 100.
PSD-X are calculated based on the number of fish in each category (stock, quality, preferred, memorable, and trophy) at the beginning of the year. That is, the length-at-age during the start of the year is used to assign PSD-X categories at age. For example, if Quality size is 300mm, an age-1 fish at 275mm at the start of the year would not be counted as a quality-sized fish, but an age-2 fish at 325mm at the start of the year would be counted as a quality-sized fish.
Details
Details will be filled out later.
Note that the main calculations are in the internal dpmBH_func (use rFAMS:::dpmBH_func to see that source code).
See also
yprBH_MinLL for estimating yield with a yield-per-recruit model using a minimum length limit and yprBH_SlotLL for estimating yield with the yield-per-recruit model and a slot limit.
See this demonstration page for more examples of this function.
Author
Jason C. Doll, jason.doll@fmarion.edu
Examples
#load required library
library(dplyr)
#>
#> Attaching package: 'dplyr'
#> The following objects are masked from 'package:stats':
#>
#> filter, lag
#> The following objects are masked from 'package:base':
#>
#> intersect, setdiff, setequal, union
library(ggplot2)
# Example of simulating yield with the dynamic pool model,
lhparms <- makeLH(N0=100,tmax=30,Linf=1349.5,K=0.111,t0=0.065,
LWalpha=-5.2147,LWbeta=3.153)
simyears <- 50
minLL <- 400
rec <- genRecruits(method = "fixed", nR = 100, simyears = simyears)
cm <- matrix(rep(c(rep(0,1), rep(0.18,(lhparms$tmax))), simyears),nrow=simyears,byrow=TRUE)
cf <- matrix(rep(c(rep(0,1), rep(0.33,(lhparms$tmax))), simyears),nrow=simyears,byrow=TRUE)
out<-dpmBH_MinLL(simyears = simyears, minLL = minLL, cf = cf,
cm = cm, rec = rec, lhparms = lhparms,
matchRicker=FALSE,species="Striped Bass",group="landlocked")
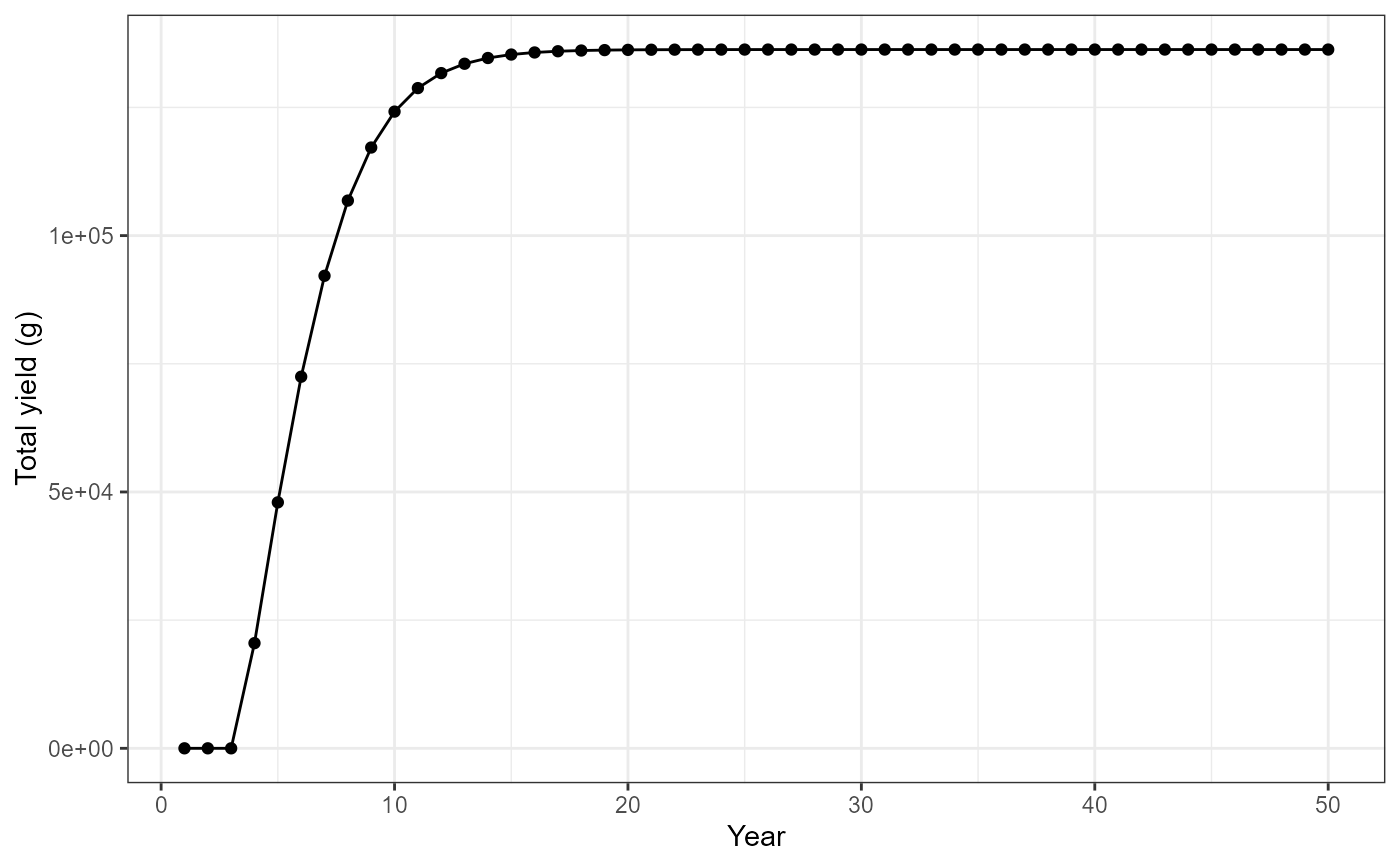
#Use summary by year data frame to plot yield vs year
ggplot(data=out[[2]],mapping=aes(x=year,y=Yield_age_1plus)) +
geom_point() +
geom_line() +
labs(y="Total yield (g)",x="Year") +
theme_bw()
 #Plot date using summary by age
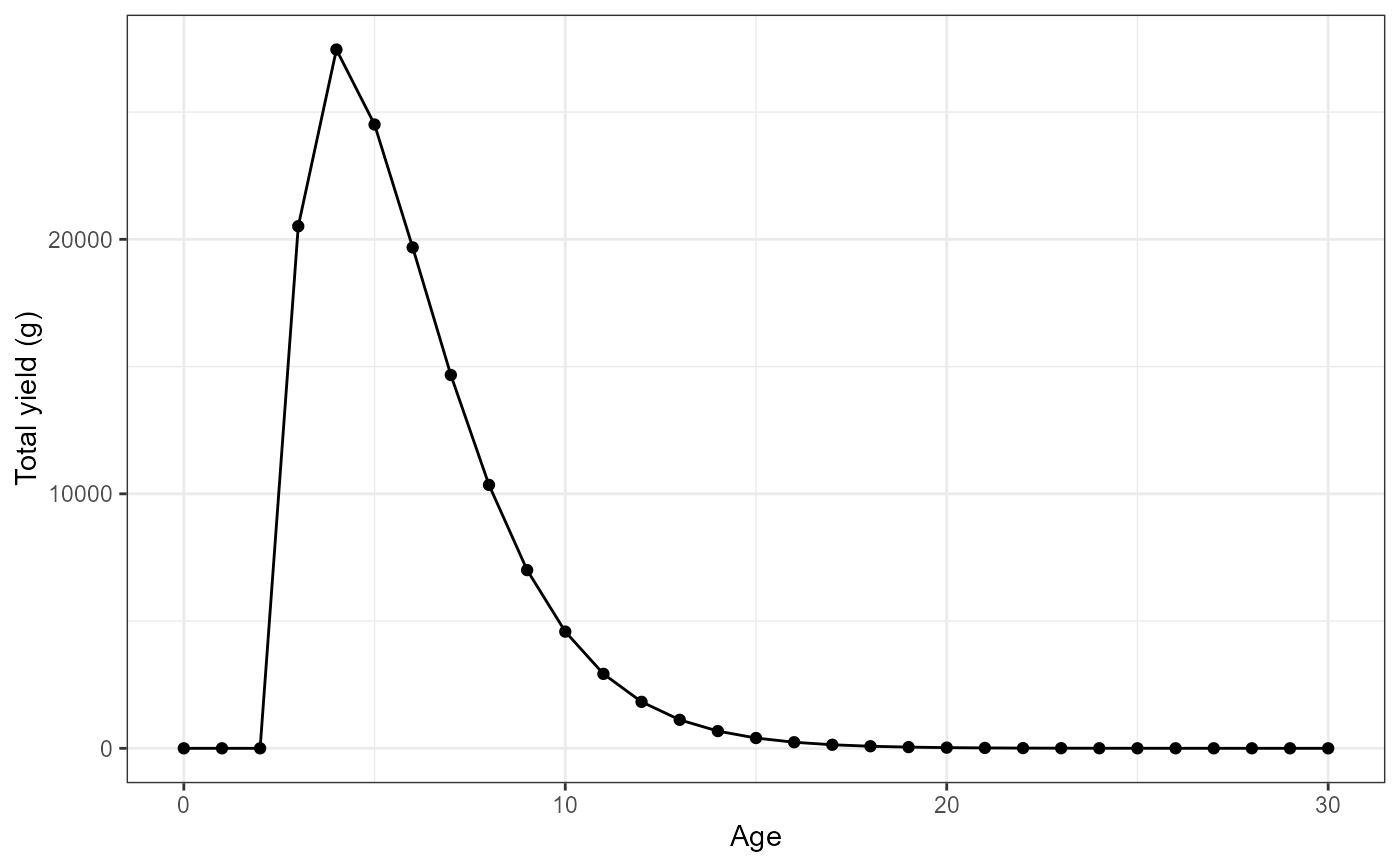
#filter for year class = 1
plotdat<- out[[1]] |> filter(yc==1)
#Plot yield vs age
ggplot(data=plotdat,mapping=aes(x=age,y=yield)) +
geom_point() +
geom_line() +
labs(y="Total yield (g)",x="Age") +
theme_bw()
#Plot date using summary by age
#filter for year class = 1
plotdat<- out[[1]] |> filter(yc==1)
#Plot yield vs age
ggplot(data=plotdat,mapping=aes(x=age,y=yield)) +
geom_point() +
geom_line() +
labs(y="Total yield (g)",x="Age") +
theme_bw()
 #Recruitment based on a normal distribution
rec <- genRecruits(method = "normal", simyears = simyears,
meanR = 1000, sdR = 500, minR = 100, maxR =2500)
cm <- matrix(rep(c(rep(0,1), rep(0.18,(lhparms$tmax))), simyears),nrow=simyears,byrow=TRUE)
cf <- matrix(rep(c(rep(0,1), rep(0.33,(lhparms$tmax))), simyears),nrow=simyears,byrow=TRUE)
out_2<-dpmBH_MinLL(minLL = minLL, cf = cf, cm = cm,
rec = rec, lhparms = lhparms,simyears = simyears,
species="Striped Bass",group="landlocked",matchRicker=FALSE)
#Use summary by year data frame to plot yield vs year
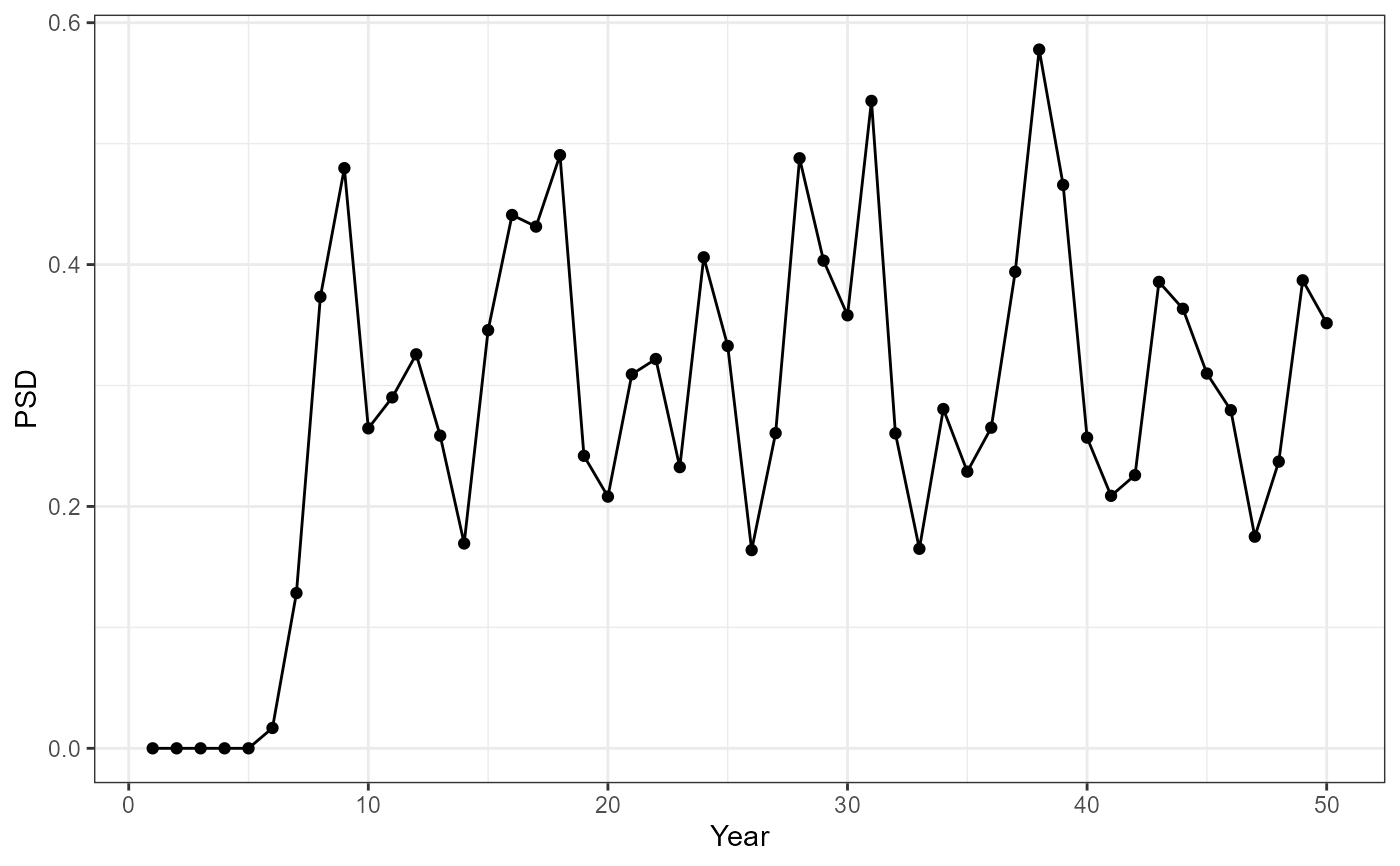
ggplot(data=out_2[[2]],mapping=aes(x=year,y=PSD)) +
geom_point() +
geom_line() +
labs(y="PSD",x="Year") +
theme_bw()
#Recruitment based on a normal distribution
rec <- genRecruits(method = "normal", simyears = simyears,
meanR = 1000, sdR = 500, minR = 100, maxR =2500)
cm <- matrix(rep(c(rep(0,1), rep(0.18,(lhparms$tmax))), simyears),nrow=simyears,byrow=TRUE)
cf <- matrix(rep(c(rep(0,1), rep(0.33,(lhparms$tmax))), simyears),nrow=simyears,byrow=TRUE)
out_2<-dpmBH_MinLL(minLL = minLL, cf = cf, cm = cm,
rec = rec, lhparms = lhparms,simyears = simyears,
species="Striped Bass",group="landlocked",matchRicker=FALSE)
#Use summary by year data frame to plot yield vs year
ggplot(data=out_2[[2]],mapping=aes(x=year,y=PSD)) +
geom_point() +
geom_line() +
labs(y="PSD",x="Year") +
theme_bw()
 #Plot date using summary by age
#Plot yield vs age for each year class
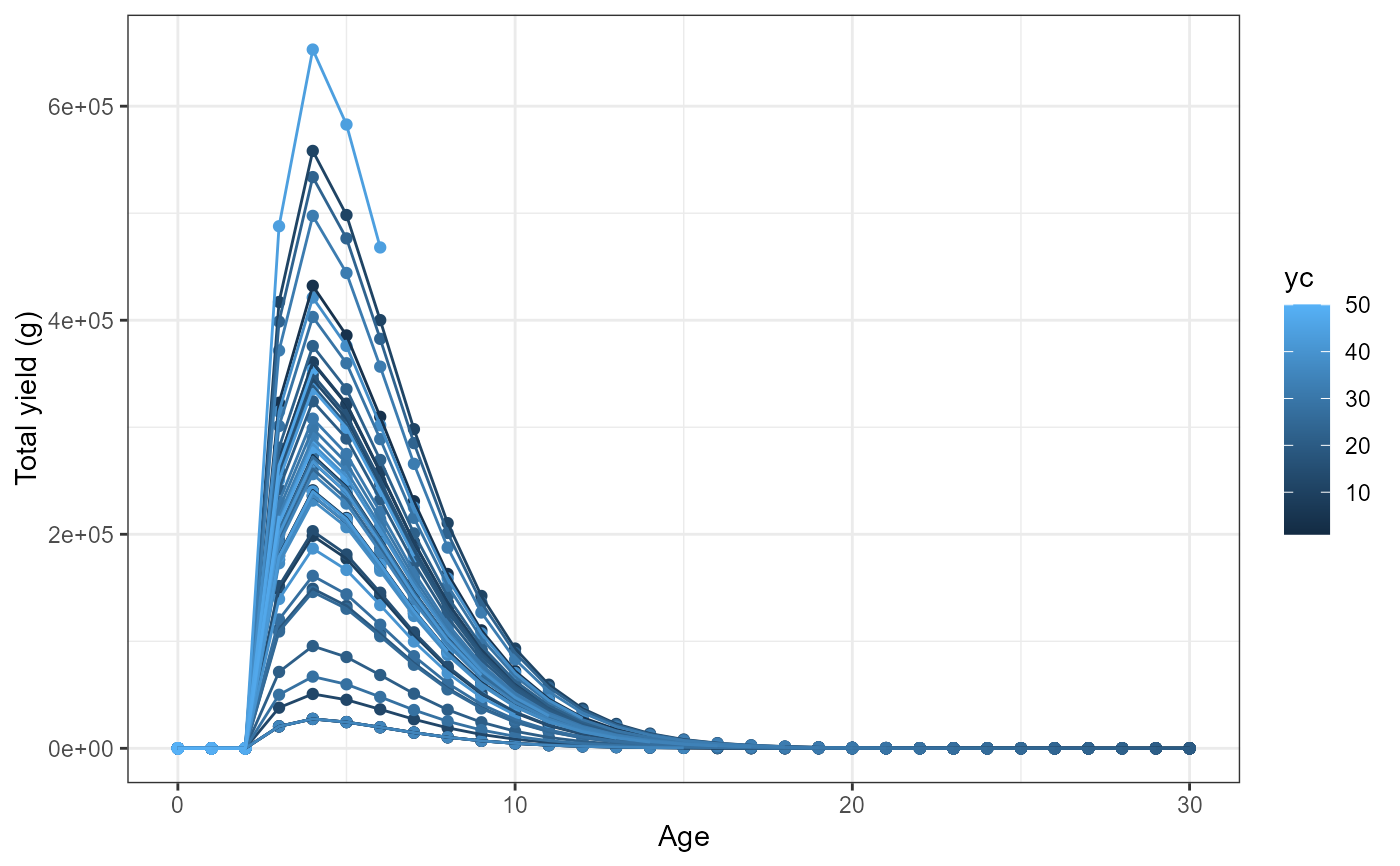
ggplot(data=out_2[[1]],mapping=aes(x=age,y=yield,group=yc,color=yc)) +
geom_point() +
geom_line() +
labs(y="Total yield (g)",x="Age") +
theme_bw()
#Plot date using summary by age
#Plot yield vs age for each year class
ggplot(data=out_2[[1]],mapping=aes(x=age,y=yield,group=yc,color=yc)) +
geom_point() +
geom_line() +
labs(y="Total yield (g)",x="Age") +
theme_bw()