Background
Motivation
Daily bag or creel limits are the maximum number of fish an angler is allowed to harvest on a daily basis. For example, a bag limit of six Walleye would limit an angler to six or fewer harvested Walleye on a given day. Bag limits are a common management tool in many fisheries, especially in inland freshwater fisheries.
Restrictive bag limits may be implemented for a variety of reasons. Most commonly it is thought that limiting the maximum number of fish an angler can harvest will reduce harvest, lower fishing mortality, and prevent over-exploitation of the fish population. However, bag limits have also been implemented to attempt to equitably distribute harvest among more anglers, provide anglers the satisfaction of reaching a goal (e.g., “I got my limit”), and to remind anglers that fish populations are a finite resource.
In this exercise, you will examine creel data (i.e., number of fish harvested by anglers) to determine how reducing the daily bag limit effects overall fish harvest.
Data
The Minnesota Department of Natural Resources (MnDNR) conducted statewide creel surveys over a 17 year period (Cook et al. 2001). The data, available in CreelMN1 records the species and number of fish harvested per angler (in one day). The data are limited to only six species2 – Walleye (WAE), Largemouth Bass (LMB), Northern Pike (NOP), Crappies (Black, White, and hybrids combined), Sunfish (Bluegill, Pumpkinseed, etc.), and Yellow Perch (YEP).
1 See “CSV file” link in “Source” section of linked page.
2 Acronyms are how the species appear in the data.
The following daily bag limits were in place during the study:
- 6 Walleye
- 6 Largemouth Bass
- 3 Northern Pike
- 15 Crappies
- 30 Sunfish
- 100 Yellow Perch
Expectations
Answer Before Continuing:
Please answer the following questions before continuing to the next section. These questions are to “get you thinking” about the topic, there is no right or wrong answer to these at this point.
- What would you expect harvest frequency3 to look like if there was a 10 bag limit in the following two situations.
- Fish are relatively difficult to catch (e.g., fish species that are widely dispersed or “shy”).
- Fish are relatively easy to catch (e.g., fish species that congregate in accessible areas or are aggressive).
3 Number of anglers harvesting a certain number of fish; see sample graph below.
- In general,4 what percentage of anglers do you think would be impacted (i.e., would have to harvest fewer fish) if the bag limit was cut in half (e.g., from 30 to 15 fish, or 6 to 3 fish)?
- In general, how much do you think the bag limit would need to be reduced (in percentage) to result in a 50% reduction in harvest? [e.g., a 20% reduction in the bag limit would be from 30 to 24 fish, or 5 to 4 fish.]
4 Not specific to the previous two situations.
Harvest Summaries
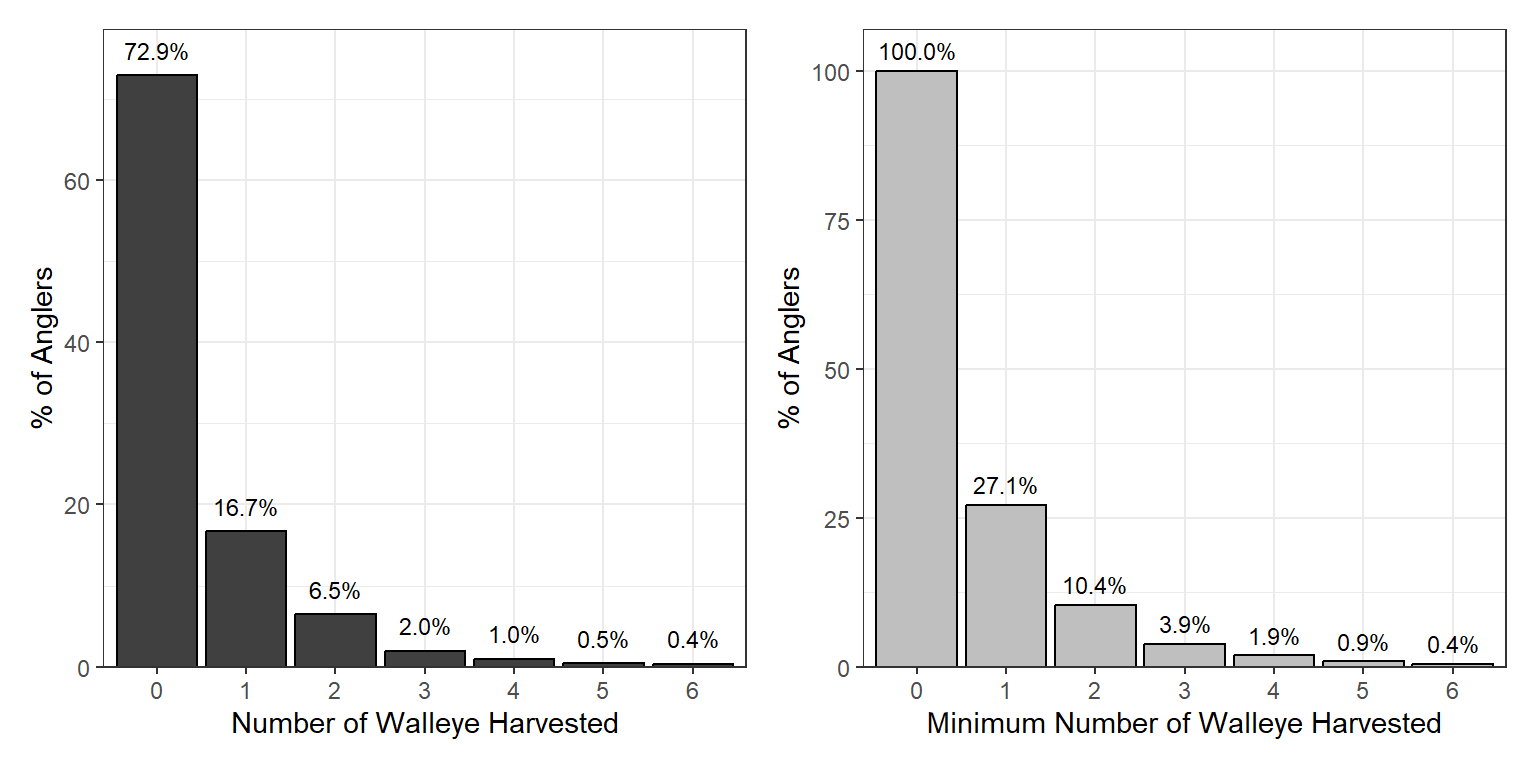
The data were summarized by species to provide the frequency and percentage of anglers that harvested a certain number of fish. For example, in Table 1, 1112 or 16.7% of anglers harvested one Walleye. In addition, the reverse cumulative sum of the percent (i.e., the percent of anglers that harvested that many fish or more) was calculated. For example, 27.1% of anglers harvested one or more Walleye.
| Harvested | Frequency | % | Reverse Cum % |
|---|---|---|---|
| 0 | 4848 | 72.9% | 100.0% |
| 1 | 1112 | 16.7% | 27.1% |
| 2 | 433 | 6.5% | 10.4% |
| 3 | 133 | 2.0% | 3.9% |
| 4 | 67 | 1.0% | 1.9% |
| 5 | 33 | 0.5% | 0.9% |
| 6 | 27 | 0.4% | 0.4% |
The results from Table 1 are also shown visually in Figure 1.
Analysis Questions
Need from Instructor
Your instructor will assign you two species to work with below. Summaries like that above for each species – Walleye, Largemouth Bass, Northern Pike, Crappie, Sunfish, and Yellow Perch. Use the results to answer the following questions for each of your species (calculations can be made with a calculator or in R).
- In a sentence or two, describe angler harvest patterns for the species.
- What percent of anglers would be affected if bag limits were reduced (to 3 for Walleye and Largemouth Bass, 2 for Northern Pike, 12 for sunfish, 5 for crappies, and 50 for Yellow Perch).
- What percent of fish would be “saved from harvest” if bag limits were reduced (under the same bag limit reductions)?
- What bag limit would be required to reduce harvest by at least 50%?
Need from Instructor
Your instructor will provide a way for you to share the results for your species with your class colleagues.
Wrap-up Questions
- What assumptions did you make (implicitly or explicitly) in your calculations? Are these assumptions likely to be true? How will “violations” of these assumptions (likely) change your results?
- How will (or did) the shape of the harvest frequency plot impact your findings?
- Are bag limits an effective tool for reducing fish harvest? What else do you need to consider to use this tool as a method to reduce fish harvest?
Solution Code:
Available upon request to students not in a class. Contact fishR maintainers.
References
Cook, M., T. Goeman, P. Radomski, J. Younk, and P. Jacobson. 2001. Creel limits in Minnesota: A proposal for change. Fisheries 26:19–26.