library(tidyverse)  # for ggplot2 (and dplyr behind the scenes) packages
library(patchwork) # for arranging multiple plots (behind the scenes)Introduction
It seems that many of my “positioning” issues in ggplot2 are ultimately solved with the use of vjust=, hjust=, or both. However, when I need to use these arguments/concepts I often find myself “googling” for a solution and then not fully internalizing how the solution worked. In this post I attempt to provide some explanation around vjust= and hjust= in hopes that I, and maybe you, will better understand how they work, and will be able to better apply them in the future.
Getting Setup
The following packages are loaded for use below.
The ggplot2 theme was set to theme_classic() and then all axis adornments were removed. The reasoning for this will be apparent below.
theme_set(theme_classic() +
            theme(axis.text=element_blank(),
                  axis.title=element_blank(),
                  axis.ticks=element_blank()))
I created an object to use for the size of the annotation text.
sz <- 5
vjust= and hjust= Explained
A basic plot, called p, that contains one red point will be the basis for all of the illustrations below.
p <- ggplot(data=data.frame(x=1,y=1),mapping=aes(x=x,y=y)) +
  geom_point(size=3,color="red")
p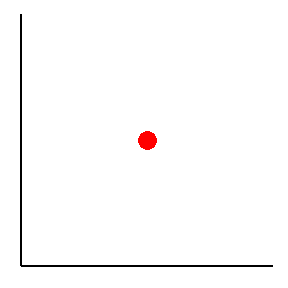
Single (or a few) labels can be added to a plot with annotation() using geom="text" and x= and y= coordinates to place the label=.1 By default the label is centered on the x-y coordinate.
1 Here the size was also changed using sz as defined above.
p + annotate(geom="text",x=1,y=1,label="default",size=sz)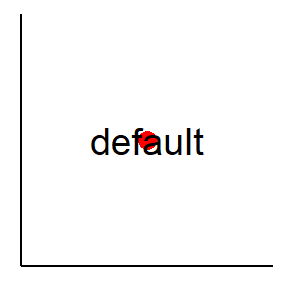
The position of the label relative to the point can be controlled with vertical and horizontal justification arguments; i.e., vjust= and hjust=. Ostensibly, vjust= and hjust= take values between 0 and 1. Values of 0.5 means “centered” in that direction. Values of 0.5 represent “centering” and are the defaults for both vjust= and hjust=. Thus, the default behavior above can be reproduced with the explicit calls to vjust= and hjust= below.
p + annotate(geom="text",x=1,y=1,label="centered",vjust=0.5,hjust=0.5,size=sz)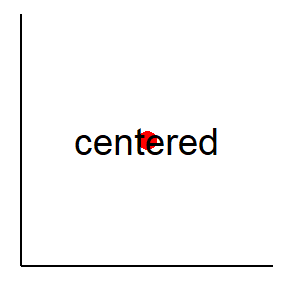
I have found the use of vjust= and hjust= to be non-intuitive but thinking of the following things has helped simplify their use for me:
- Justification is about the label/object relative to the coordinate, not the coordinate relative to the label/object.
- Vertical scales (in the first quadrant) have 0 at the bottom and 1 at the top.
- Horizontal scales (in the first quadrant) have 0 to the left and 1 to the right.
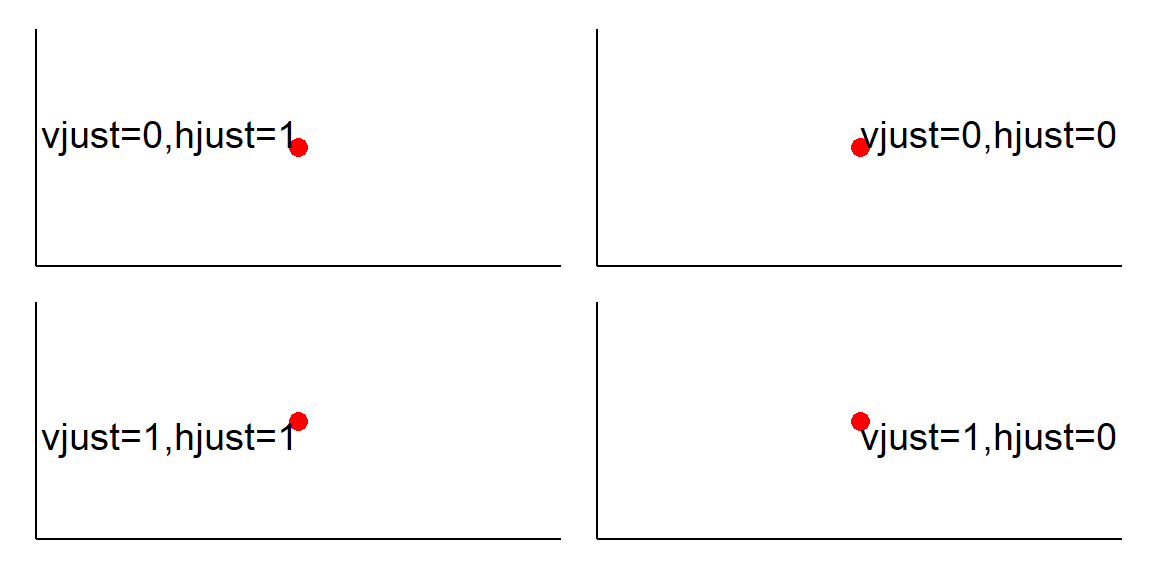
Thus, for example (see below), vjust=0 will place the “bottom” (i.e., 0) of the label on the x-y coordinate, whereas vjust=1 will place the “top” (i.e., 1) of the label on the x-y coordinate. If hjust= is left at the default of 0.5 then the labels will remain horizontally centered with these changes to vjust=.
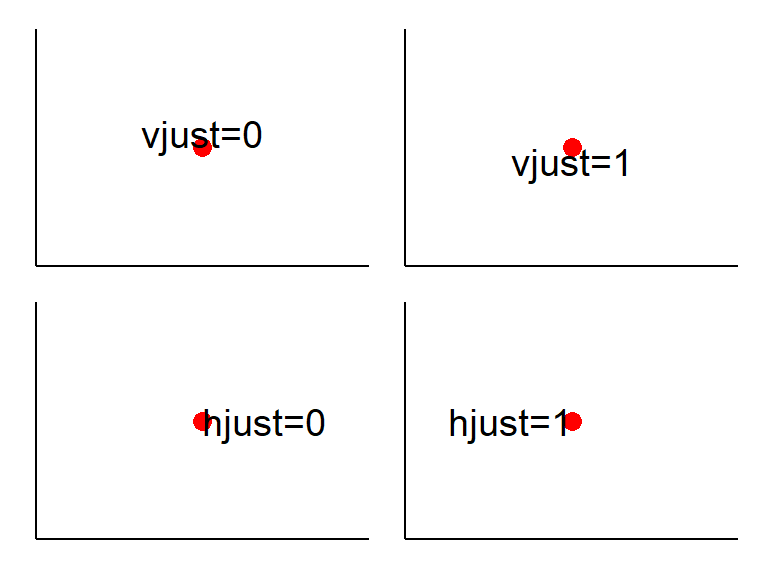
Further, hjust=0 will place the “left” side (i.e., 0) of the label on the x-y coordinate and hjust=1 will place the “right” side (i.e., 1) of the label on the x-y coordinate. If vjust= is not changed from the default then these labels will be centered vertically.
Both vjust= and hjust= can be modified simultaneously to position the label nearly anywhere around the x-y coordinate (see below). For example, vjust=0 and hjust=1 will place the lower (from vjust=0) right (from hjust=1) corner of the label on the x-y coordinate.
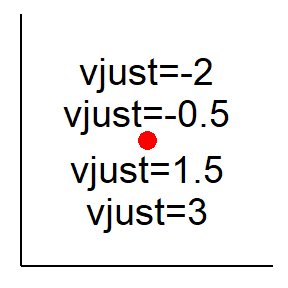
Even more control comes from the fact that values outside of 0 and 1 can be used (see below). For example, negative values for vjust= will place the bottom of the label further away (so above) from the x-y coordinate. Alternatively, values greater than 1 for vjust= will place the top of the label further away (so below) from the x-y coordinate.
Similar behavior occurs for hjust=, with negative numbers moving the label further to the right and values greater than 1 moving the label further to the left of the x-y coordinate (see below).
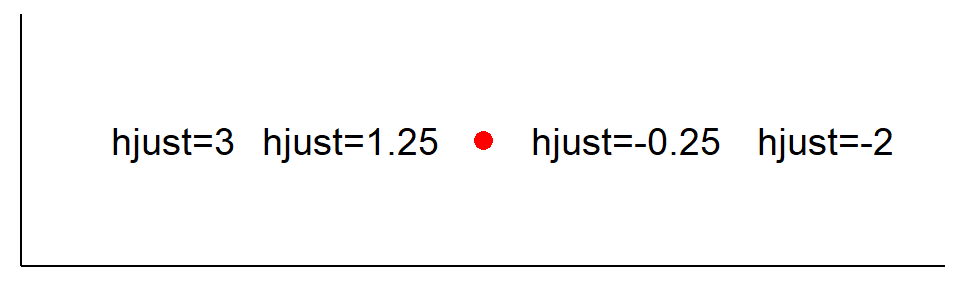
I will often use values outside of 0 to 1 so that my labels do not overlap the point.
Practical Examples
Here I will demonstrate some practical uses of vjust= and hjust= on the final plot constructed in the previous post. This plot is saved as p1, is repeated below,2 and is used here just to have something to use as an example.
2 See the previous post for the plot construction code.
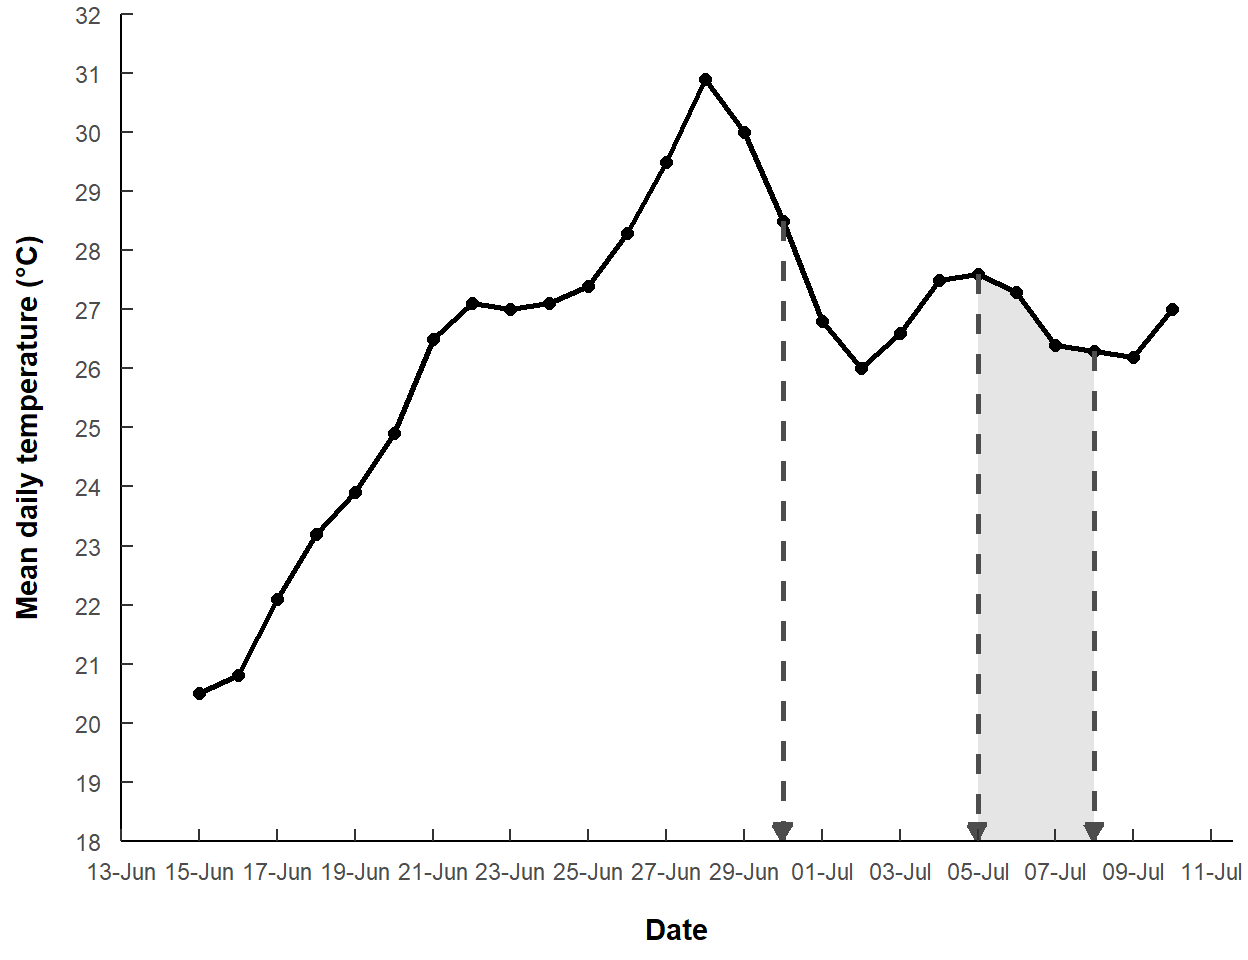
Labels
Suppose that we want to highlight the peak temperature point with a label. With this plot, the label would be best above and horizontally centered on the peak point. Thus, hjust= will be left at the default of 0.5 and vjust= will be set to a negative number (i.e., 0 would place the bottom of the label on the point, we want to move it up further so a negative number is needed).3
3 Here and below I colored the text red to show the change being made.
p1 +
  annotate(geom="text",x=as.Date("28-Jun-2021",format=dfmt),
           y=max(dat$temp),label="Warmest Day!",vjust=-1,color="red")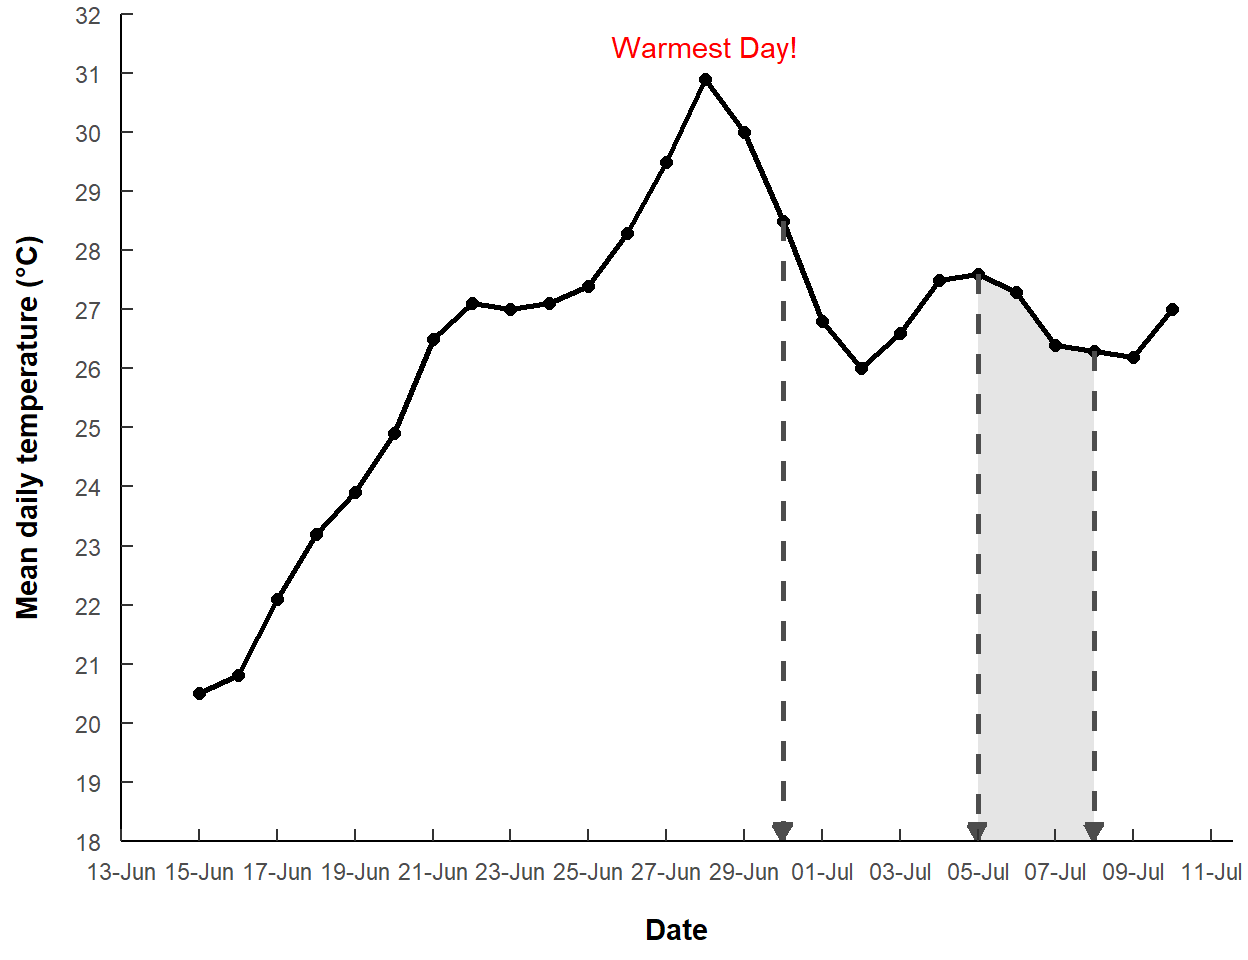
The same concept works for using geom_text() to label all points.
p1 +
  geom_text(data=dat,mapping=aes(x=date,y=temp,label=temp),
            vjust=-1,size=3,color="red")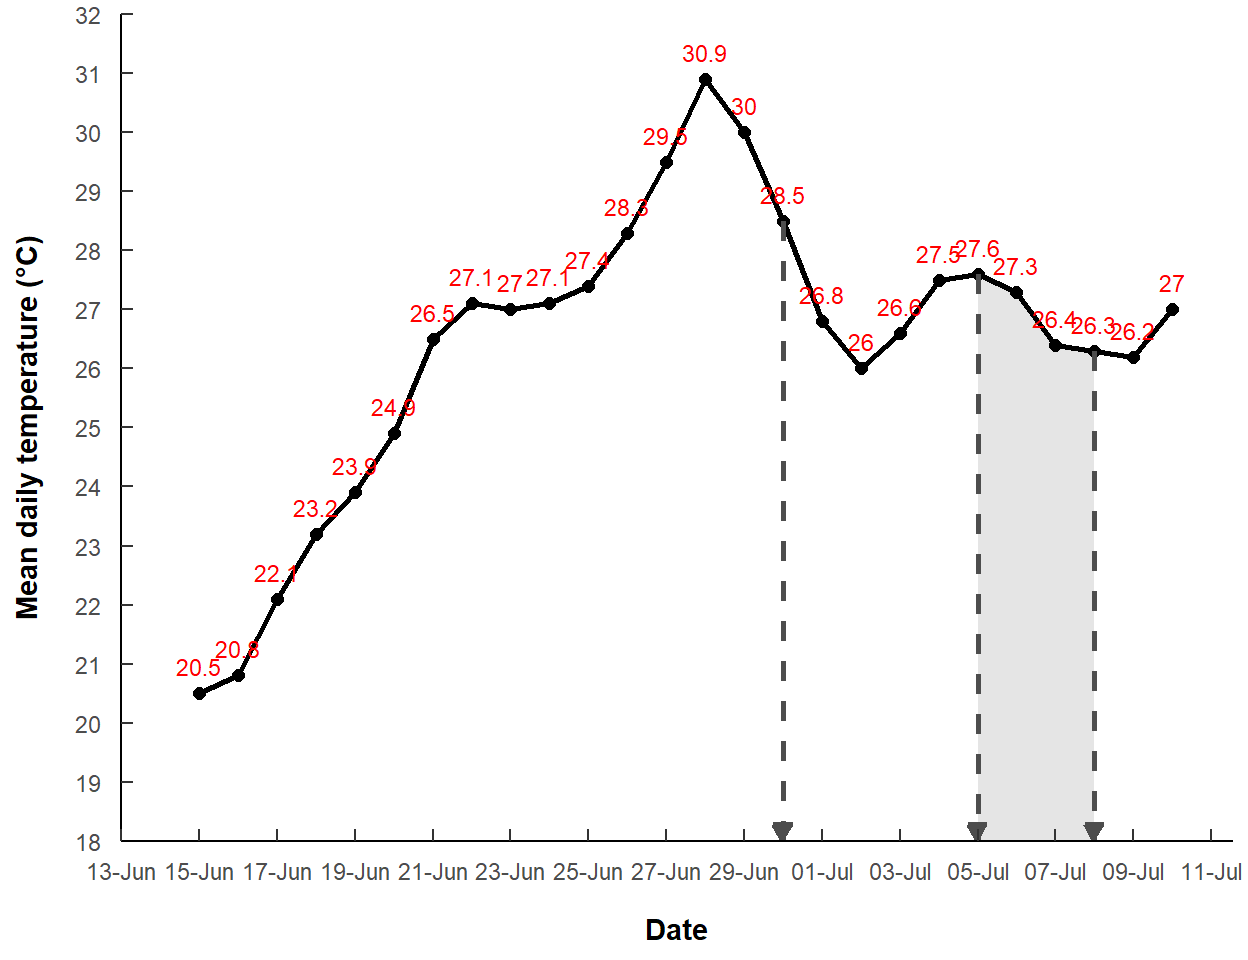
Of course, this does not work well here because the same justification is used for every point, so there is overlap with the line, other labels, etc. If you really want to do something like this then look at functionality in the ggrepel and ggpp packages.
Plot Title
A title may be added to a plot with title= in labs(). By default, the title is left-justified with respect to the plot body. The title can be centered by modifying plot.title= in theme() with hjust=0.5 within element_text().4
4 plot.title= is a text element, thus the use of element_text() here.
p1 +
  labs(title="Pacific Lamprey Mortality Events") +
  theme(plot.title=element_text(hjust=0.5,color="red"))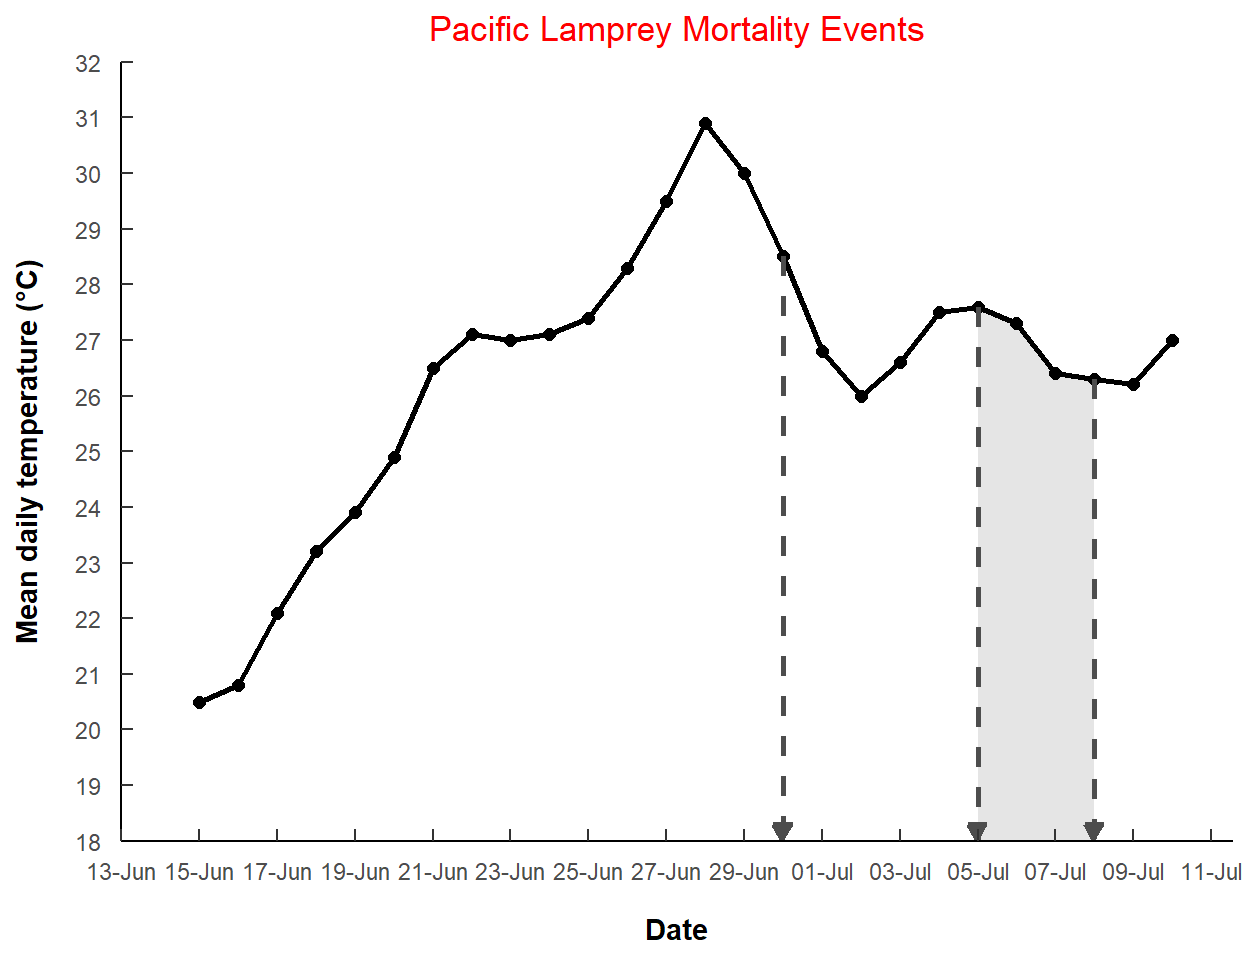
This is also demonstrated in this previous post.
Plot Tag Label
If multiple plots are placed together it is common to adorn each plot with a letter or some other signifier. Suppose that this plot will be the first in a series of plots and, thus, an “(A)” should be placed in the upper-left corner. It is best not to specific numeric values for the upper-left corner because (a) that can be tricky if the axis limits have been expanded, (b) it depends on the data in the plot, and (c) it is hard to be consistent across plots. One trick here is that ggplot2 will define the upper-left corner at -Inf for the x and Inf for the y-coordinate.5 The problem with this is that the label is centered on those extreme coordinates and is cutoff and over the axis (see below).
5 The -Inf had to be converted to a date because the x-axis is dates.
p1 +
  annotate(geom="text",x=as.Date(-Inf,format=dfmt),y=Inf,label="(A)",color="red")
We can set the upper-left corner of the label to be at the coordinate to move the label into the plotting region. However, to further move the point off the extreme coordinate position, use a value greater than 1 for vjust= (i.e., move the top further down) and a negative value for hjust= (i.e., move the left side further to the right).
p1 +
  annotate(geom="text",x=as.Date(-Inf,format=dfmt),y=Inf,label="(A)",color="red",
           vjust=1.5,hjust=-1)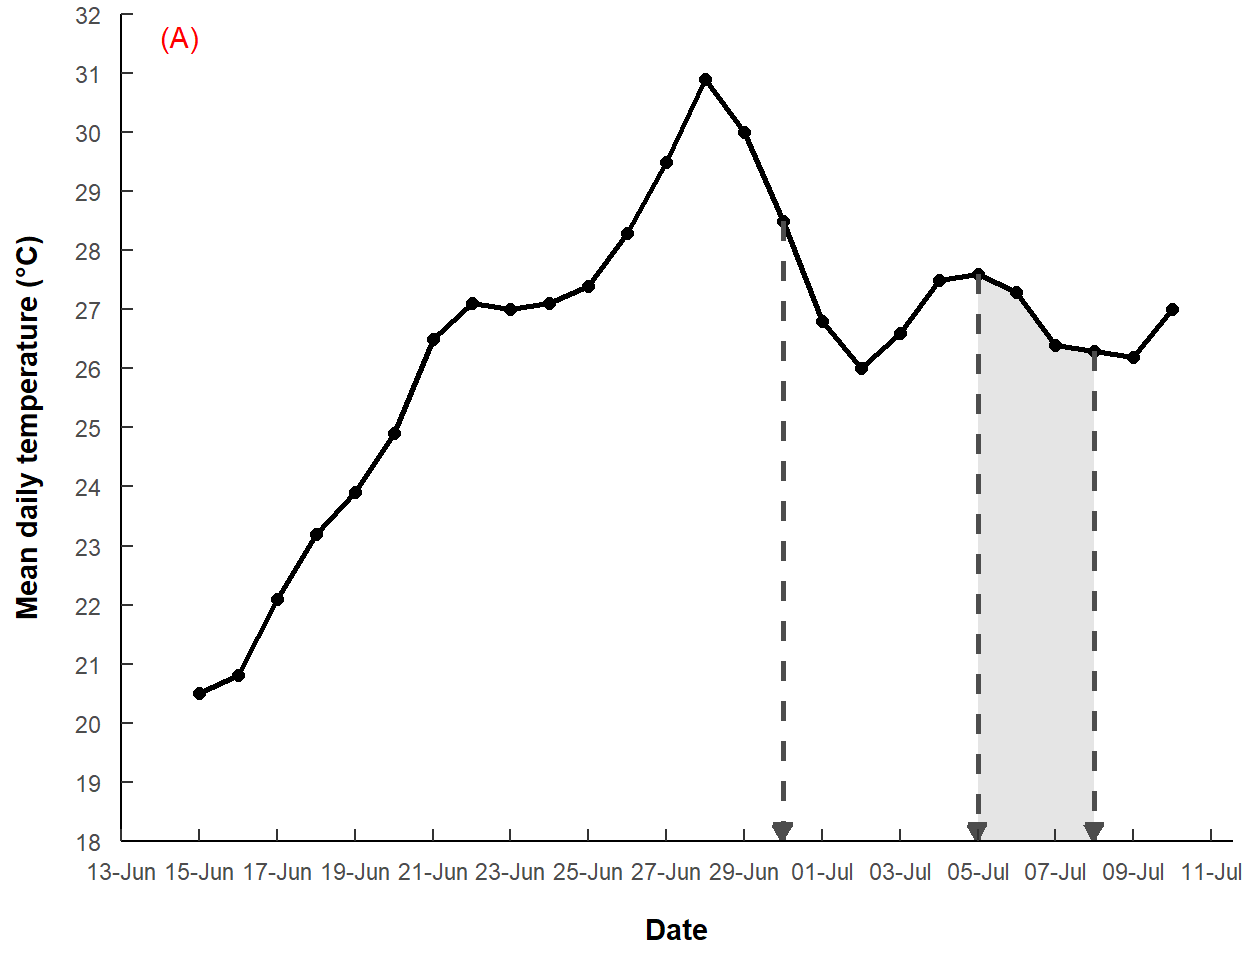
This is also demonstrated in this previous post.
Rotated Axis Labels
The labels on the x-axis are crowded. One way to adjust for this is to rotate the labels to a vertical position using angle=90 in element_text() for axis.text.x= in theme=. However, as seen below, the labels are then not horizontally aligned with the tick marks.
p1 +
  theme(axis.text.x=element_text(angle=90,color="red"))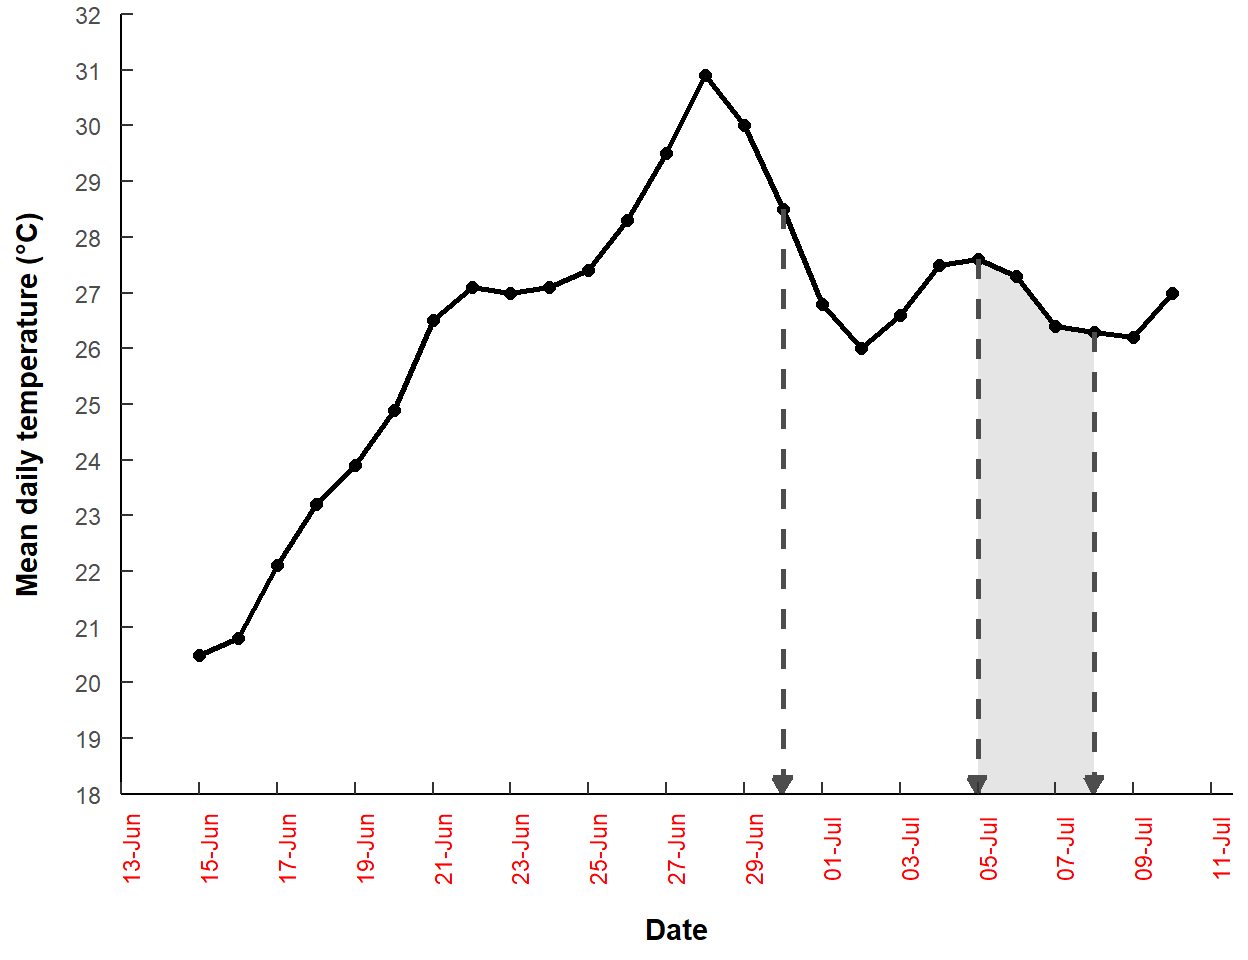
It would seem that hjust= is needed to correct this horizontal alignment problem. However, it is vjust= that is used. I am not sure that I fully understand this but I think that it means that the “top” and the “bottom” of the labels were not “renamed” with the rotation and, thus, are still controlled with vjust=.
p1 +
  theme(axis.text.x=element_text(angle=90,vjust=0.5,color="red"))
Legend Position
The concepts of vjust= and hjust= are also used when placing a legend within the plotting area, though those arguments are not used explicitly.
I modified the base plot from above to have a legend. Note that the grouping here is not really useful, I am just using this as an illustration of how to move the legend. This object is called p2.
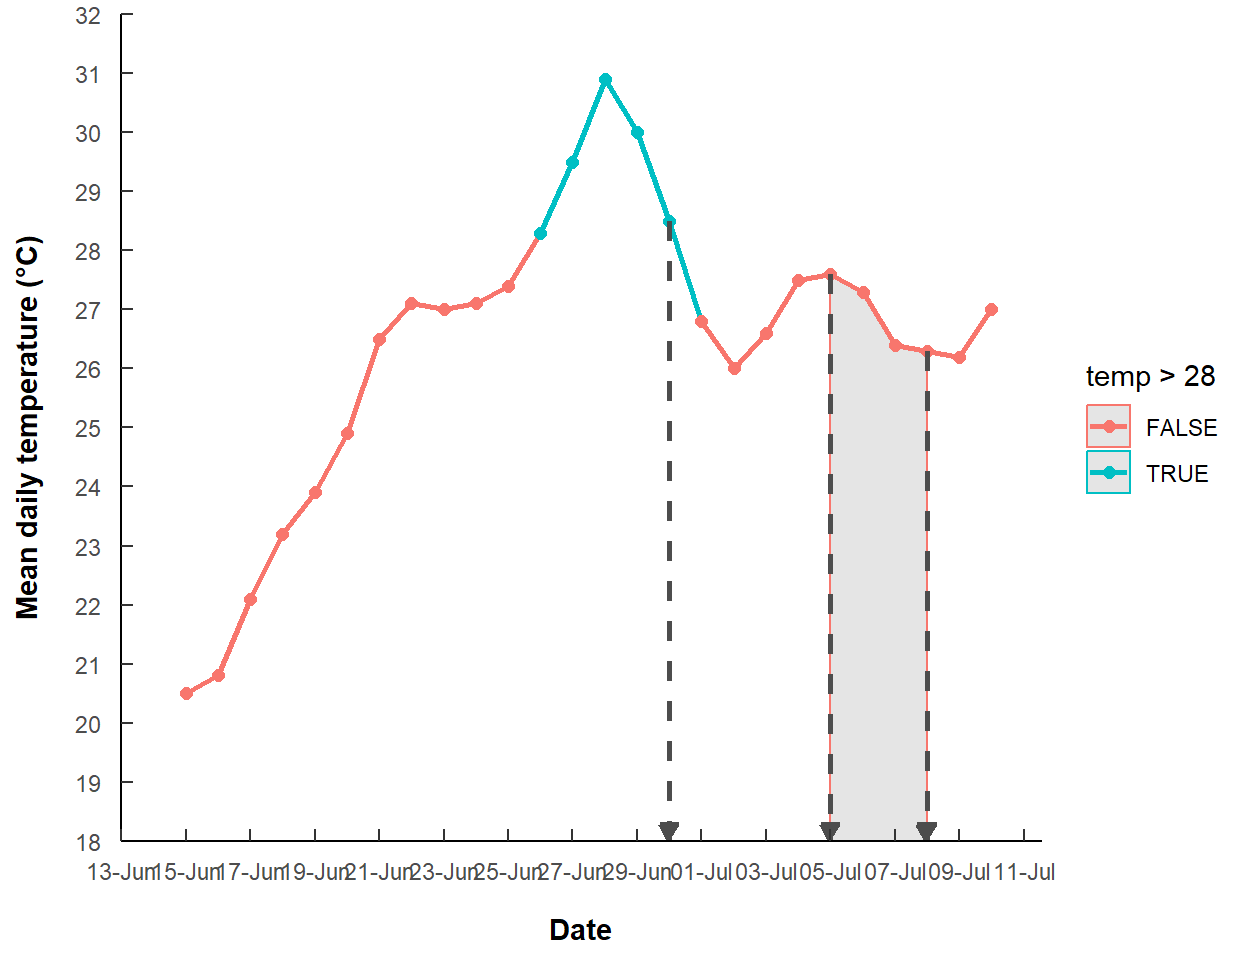
The position of the legend is controlled by legend.position= in theme(). The legend can be moved into the plot by providing a vector of length two that defines the proportional distance down the x-axis (0 is all the way to the left) and proportional distance up the y-axis (0 is at the bottom). Thus, the code below puts the legend in the upper-left corner of the plot (i.e., 0 is to the left, 1 is top).
p2 +
  theme(legend.position=c(0,1))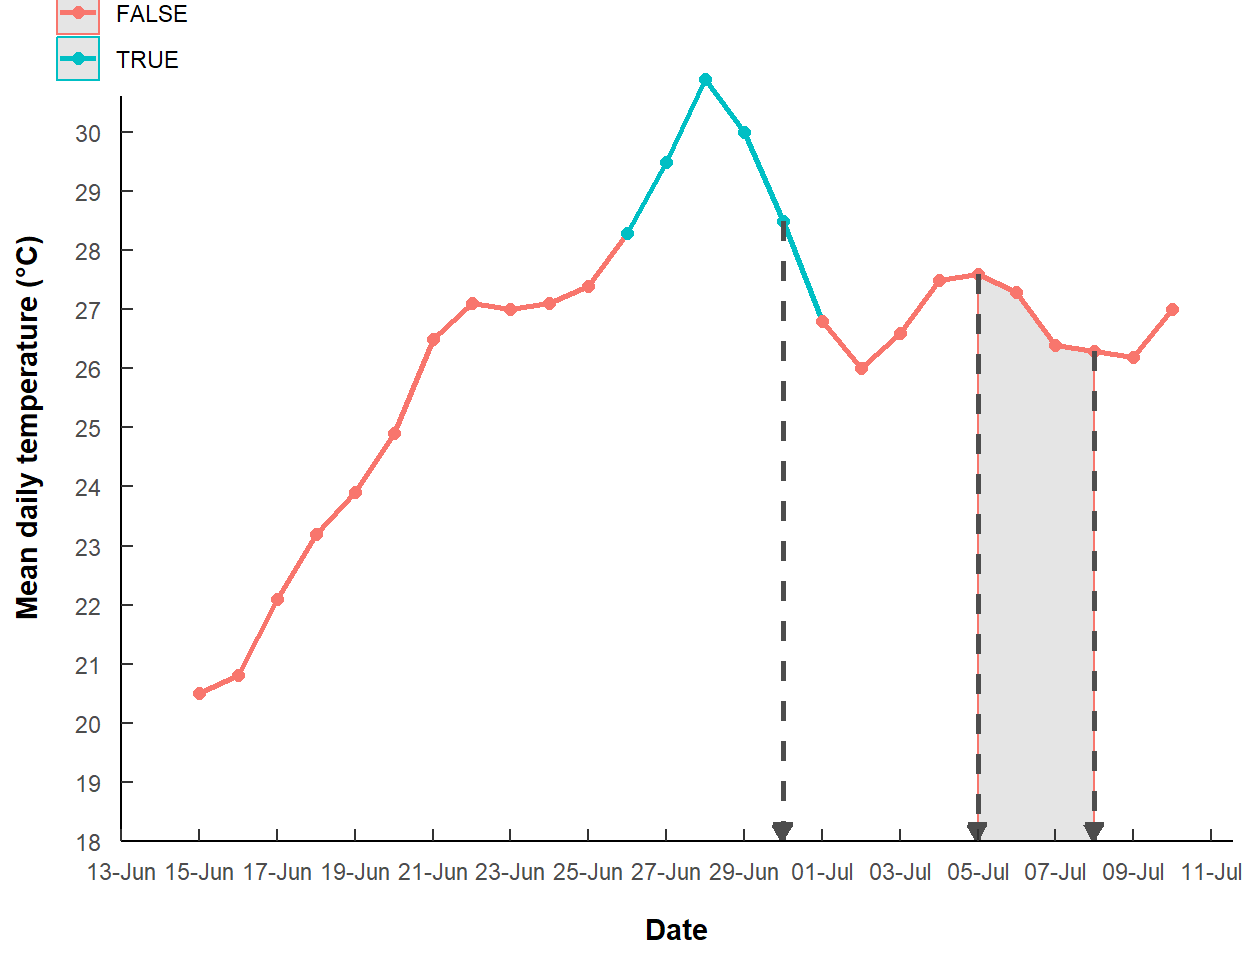
However, the legend is centered on this coordinate. The justification of the legend is adjusted with legend.justification= in theme(). Again a vector of length two is required here with the first value serving like hjust= and the second value like vjust=. Here I would like the upper-left corner of the legend to be a little right (so a negative first value) and a little down (so a value greater than 1 for the second value) from the “coordinate” in legend.position=.
p2 +
  theme(legend.position=c(0,1),
        legend.justification=c(-0.25,1.1))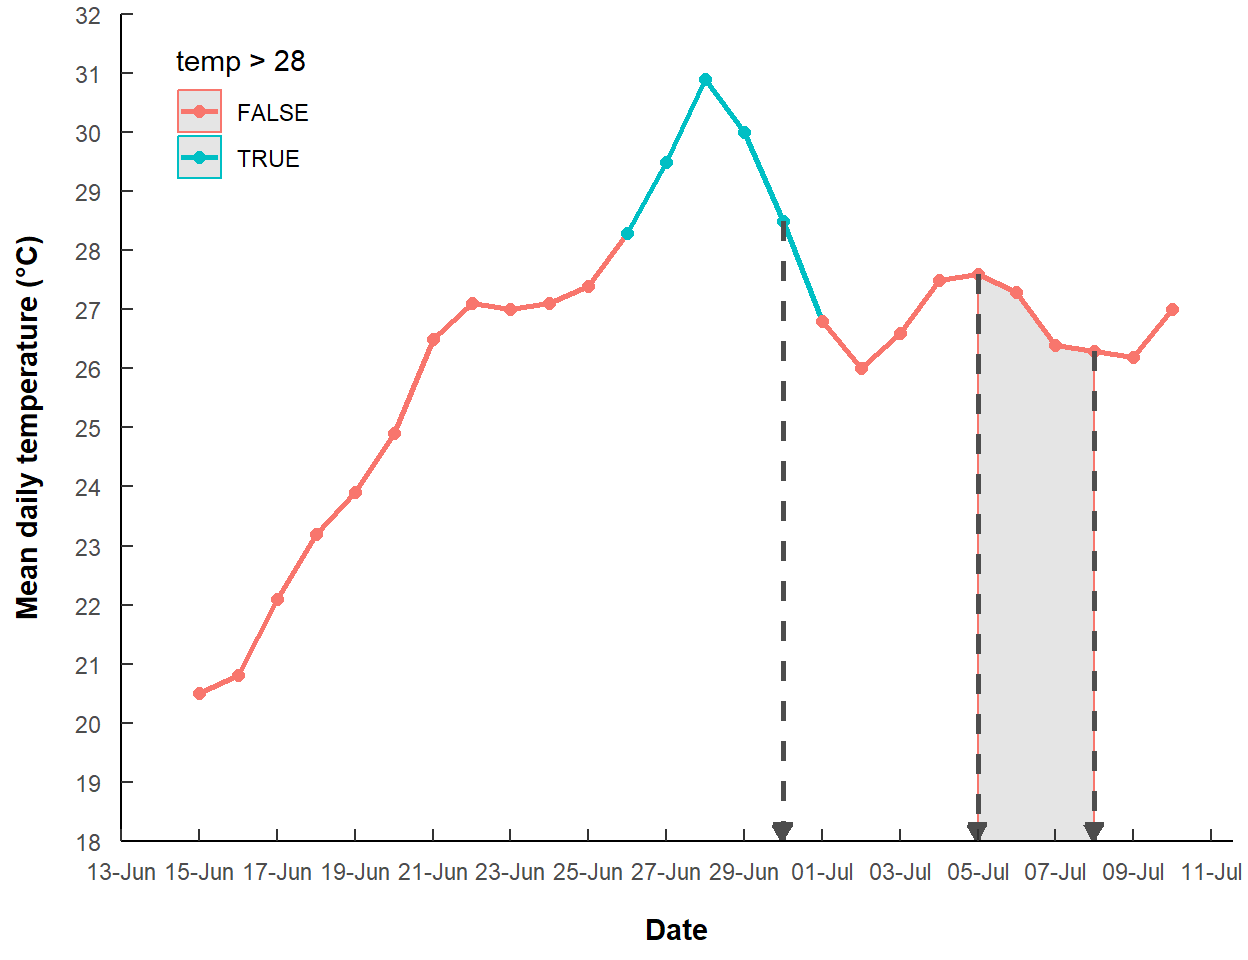
Another example where legend.position= puts the legend in the upper-right corner and legend.justification= positions the upper-right corner of the legend a little to the left and down from the legend.position= “coordinate.”
p2 +
  theme(legend.position=c(1,1),
        legend.justification=c(1.25,1.1))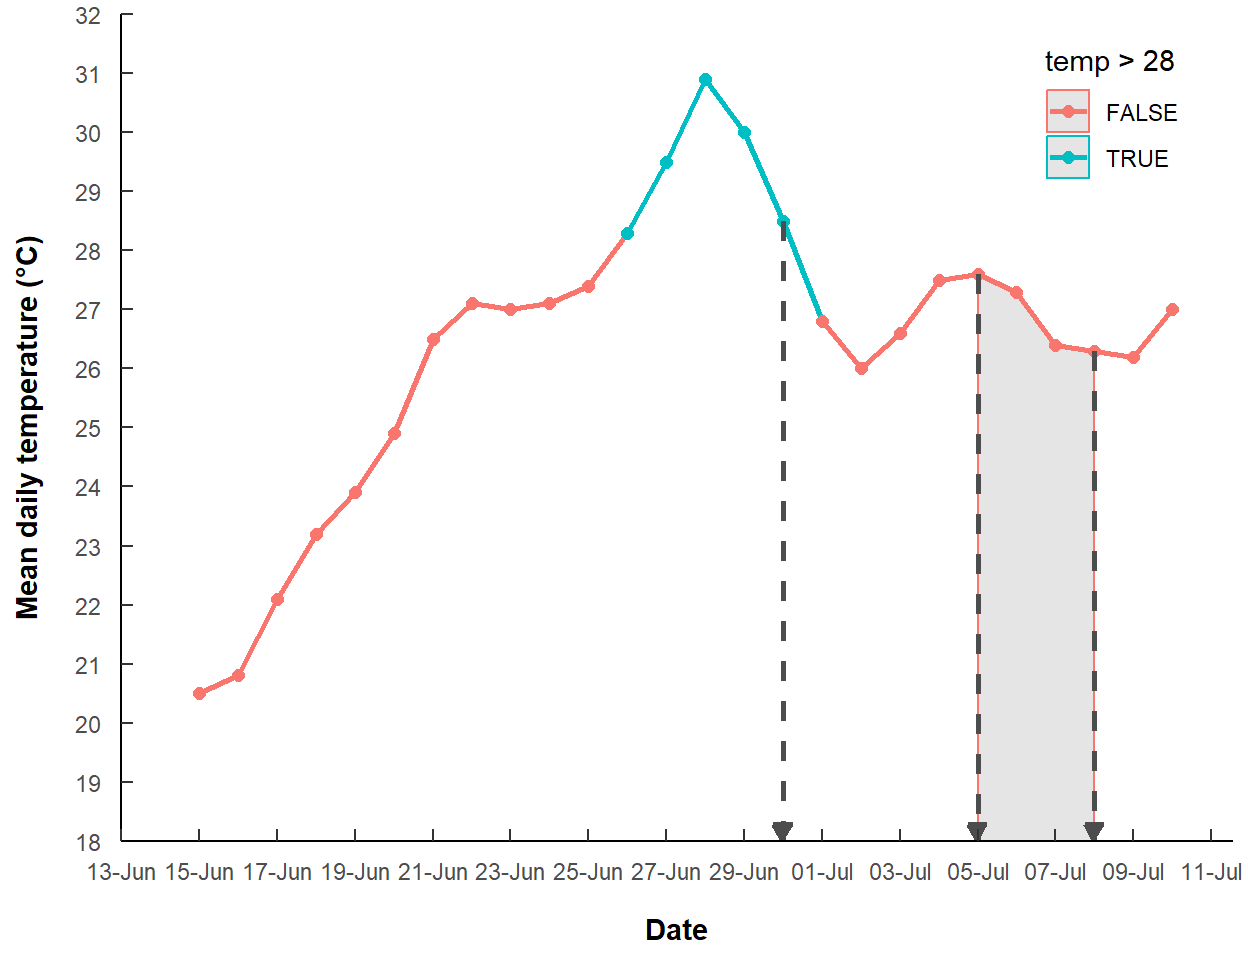
Reuse
Citation
BibTeX citation:
@online{h._ogle2023,
  author = {H. Ogle, Derek},
  title = {Using Vjust= and Hjust=},
  date = {2023-03-10},
  url = {https://fishr-core-team.github.io/fishR/blog/posts/2023-3-10-Text_Annotation_Position/},
  langid = {en}
}
For attribution, please cite this work as:
H. Ogle, D. 2023, March 10. Using vjust= and hjust=. https://fishr-core-team.github.io/fishR/blog/posts/2023-3-10-Text_Annotation_Position/.