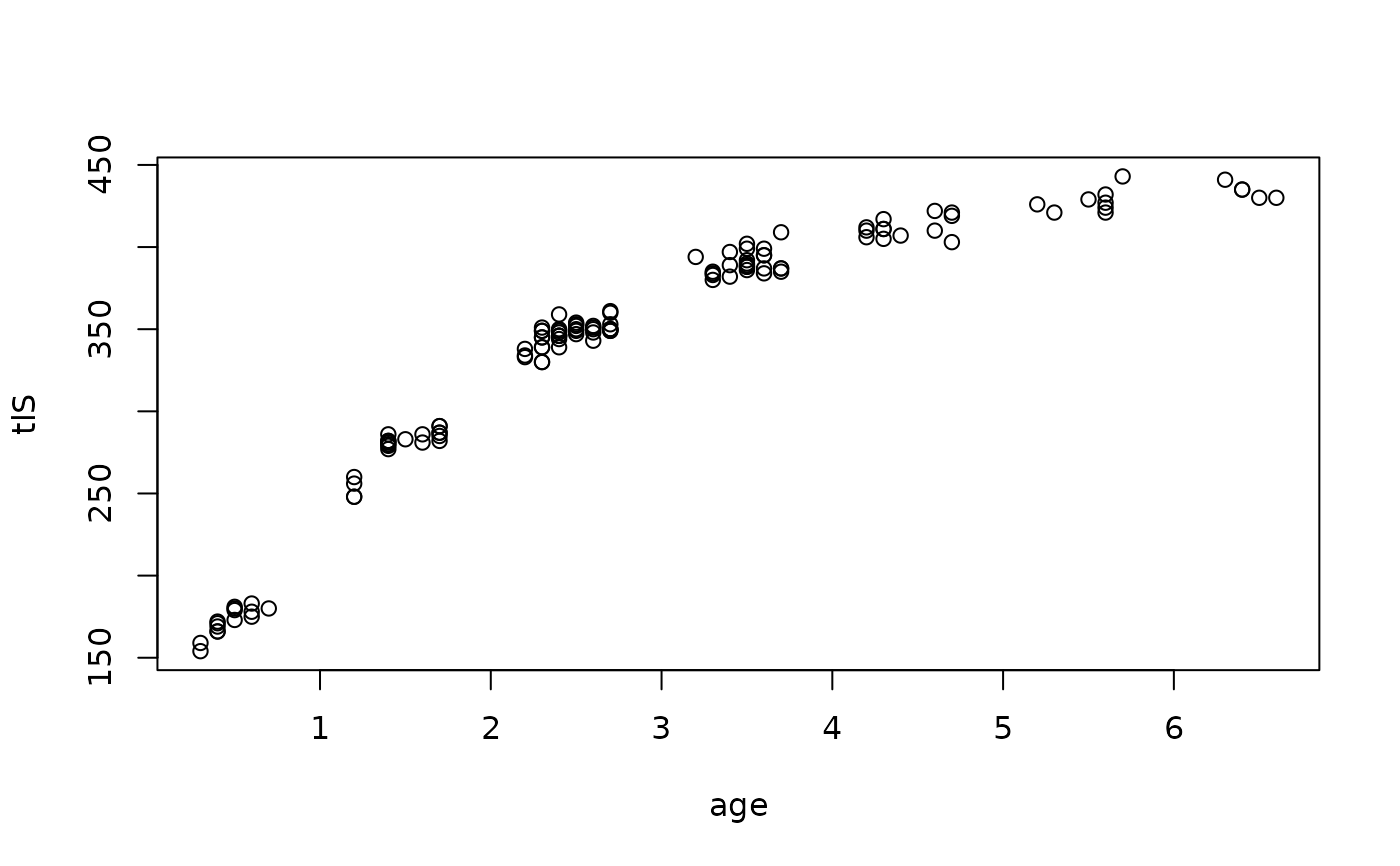
Hypothetical lengths at seasonal ages. These data are useful for testing growth related functions (e.g., findGrowthStarts) as they were generated from known growth functions (e.g., von Bertalanffy) with some random error and are, thus, “as good as it gets” for testing.
Format
A data frame of 126 observations on the following 2 variables:
- age
Ages with decimals representing a fraction of a year
- tlS
Total length simulated from a the “Somers” parameterization of the von Bertalanffy growth function with Linf=450, K=0.3, t0=-0.5, C=0.9, and ts=0.1
See also
GrowthData1, GrowthData2, and findGrowthStarts
Examples
str(GrowthData2)
#> 'data.frame':	126 obs. of  2 variables:
#>  $ age: num  0.4 0.7 0.3 0.6 0.5 0.5 0.4 0.4 0.4 0.4 ...
#>  $ tlS: num  171 180 159 178 181 179 166 166 169 172 ...
head(GrowthData2)
#>   age tlS
#> 1 0.4 171
#> 2 0.7 180
#> 3 0.3 159
#> 4 0.6 178
#> 5 0.5 181
#> 6 0.5 179
plot(tlS~age,data=GrowthData2)

