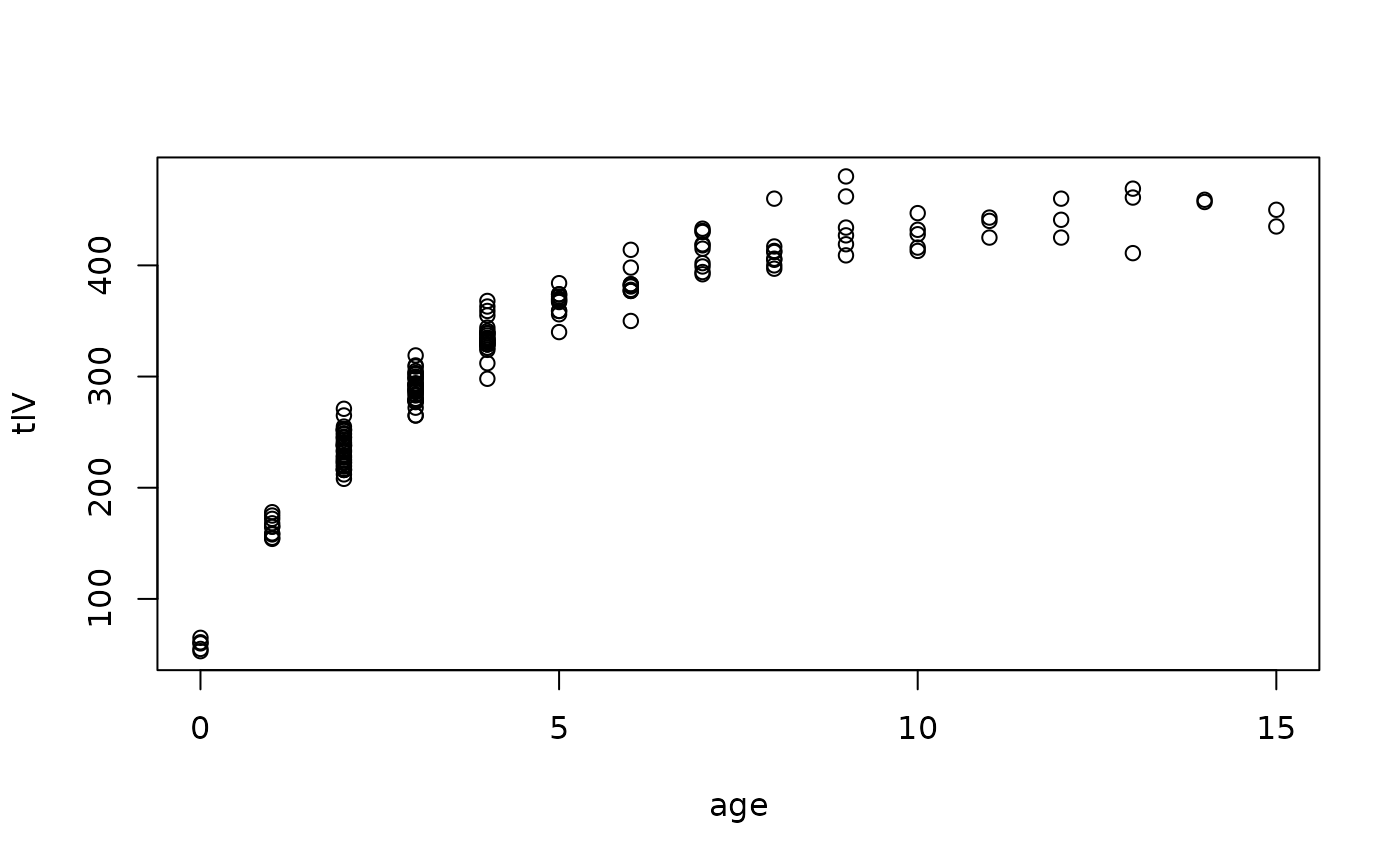
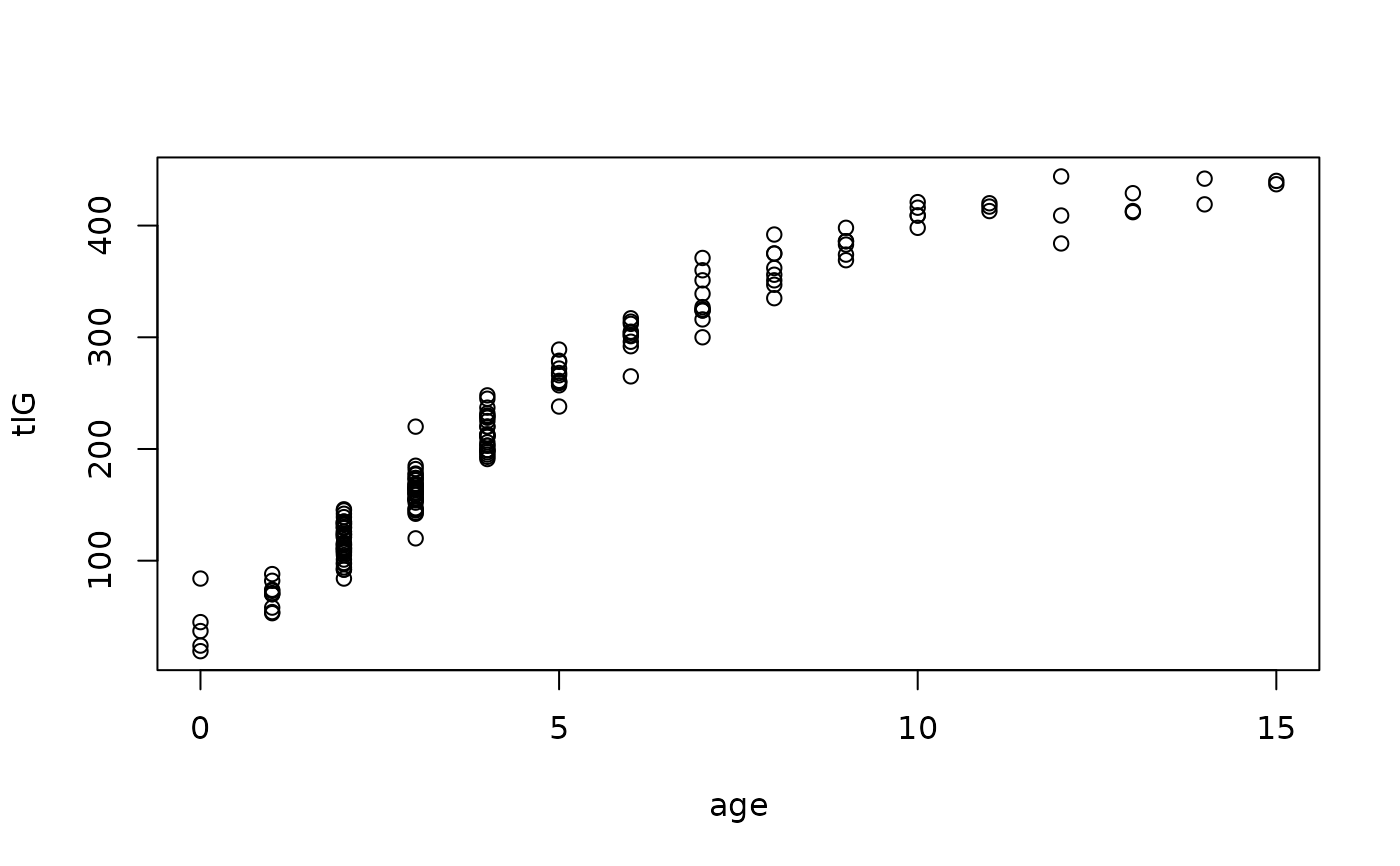
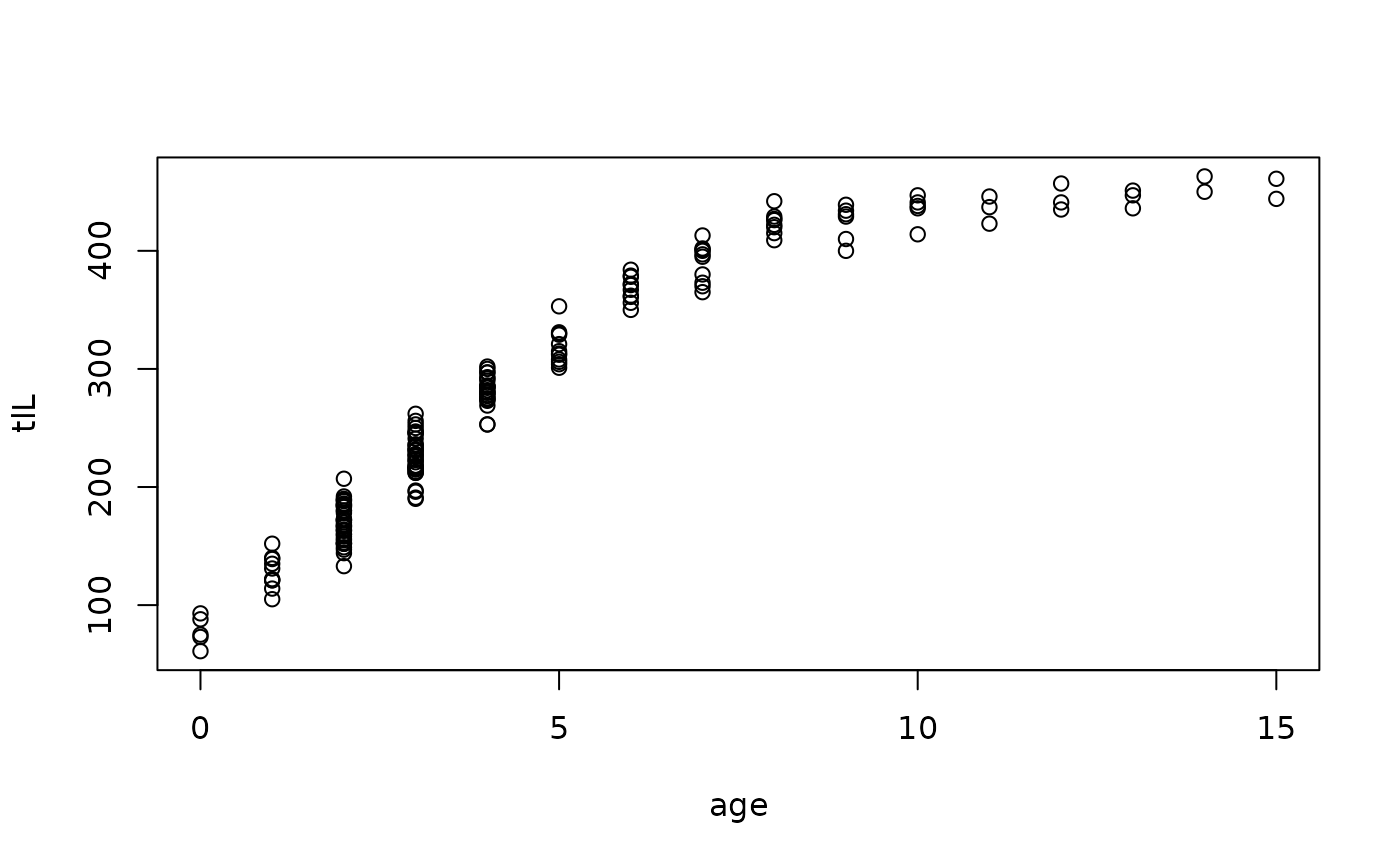
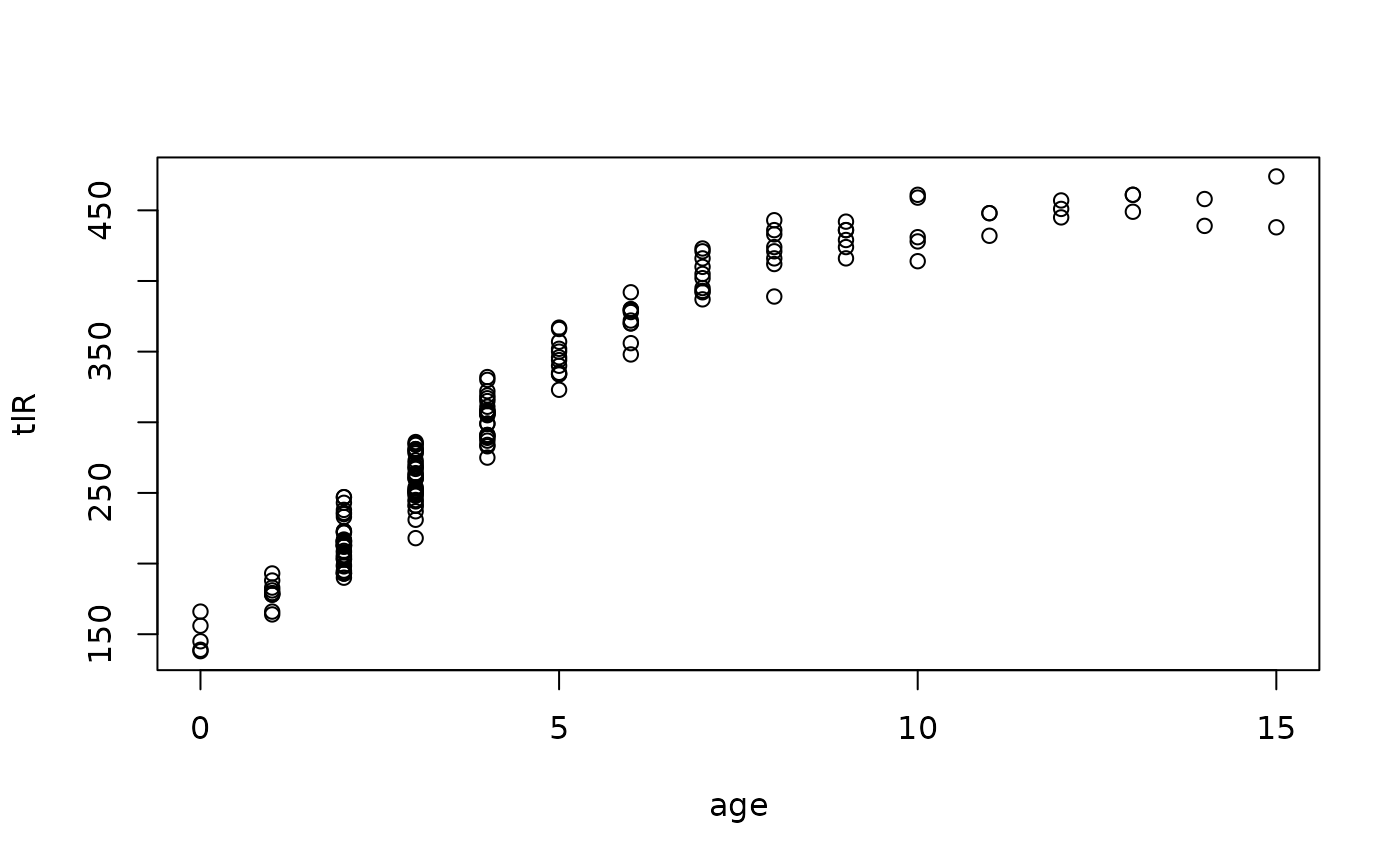
Hypothetical lengths at annual ages. These data are useful for testing growth related functions (e.g., findGrowthStarts) as they were generated from known growth functions (e.g., von Bertalanffy) with some random error and are, thus, “as good as it gets” for testing.
Format
A data frame of 179 observations on the following 5 variables:
- age
Ages as a whole number
- tlV
Total length simulated from a von Bertalanffy growth function with Linf=450, K=0.3, and t0=-0.5
- tlG
Total length simulated from a Gompertz growth function with Linf=450, gi=0.3, and ti=3
- tlL
Total length simulated from a logistic growth function with Linf=450, gninf=0.5, and ti=3
- tlR
Total length simulated from a Richards growth function with Linf=450, k=0.5, ti=2, and b=-0.5
Examples
str(GrowthData1)
#> 'data.frame':	179 obs. of  5 variables:
#>  $ age: int  0 0 0 0 0 1 1 1 1 1 ...
#>  $ tlV: num  61 53 65 55 60 172 165 165 175 154 ...
#>  $ tlG: num  45 19 84 37 24 70 53 88 70 54 ...
#>  $ tlL: num  61 93 75 88 73 152 105 121 122 135 ...
#>  $ tlR: num  145 138 139 156 166 183 179 193 178 166 ...
head(GrowthData1)
#>   age tlV tlG tlL tlR
#> 1   0  61  45  61 145
#> 2   0  53  19  93 138
#> 3   0  65  84  75 139
#> 4   0  55  37  88 156
#> 5   0  60  24  73 166
#> 6   1 172  70 152 183
plot(tlV~age,data=GrowthData1)

plot(tlG~age,data=GrowthData1)

plot(tlL~age,data=GrowthData1)

plot(tlR~age,data=GrowthData1)

