Ages, lengths, and maturity for female Yelloweye Rockfish (Sebastes rubberimus) from Oregon.
Format
A data frame with 159 observations on the following 5 variables.
- date
Date fish was collected
- length
Total length (cm)
- age
Otolith age
- maturity
Maturity state (
ImmatureorMature)- stage
Stage of maturity (
1:Immature,2:Maturing,3:Mature,4:Fertilized,5:Ripe,6:Spent,7:Resting)
Source
Obtained directly (from Bob Hannah). Data were used in Hannah, R.W, M.T.O. Blume, and J.E. Thompson. 2009. Length and age at maturity of female yelloweye rockfish (Sebastes rubberimus) and cabezon (Scorpaenichthys marmoratus) from Oregon waters based on histological evaluation of maturity. Oregon Department of Fish and Wildlife, Information Reports 2009-04. [Was (is?) from http://www.dfw.state.or.us/mrp/publications/docs/Info200904_YlwEyeRF_Maturity.pdf] CSV file
Examples
data(YERockfish)
str(YERockfish)
#> 'data.frame': 158 obs. of 5 variables:
#> $ date : Factor w/ 71 levels "10/1/2003","10/2/2003",..: 66 9 38 25 60 6 37 48 34 39 ...
#> $ length : int 31 32 32 32 32 33 33 34 34 34 ...
#> $ age : int 10 6 11 11 13 9 10 8 10 11 ...
#> $ maturity: Factor w/ 2 levels "Immature","Mature": 1 1 1 1 1 1 1 1 1 1 ...
#> $ stage : Factor w/ 9 levels "1","2","3","4",..: 1 1 1 2 2 1 1 1 1 1 ...
head(YERockfish)
#> date length age maturity stage
#> 1 9/2/2003 31 10 Immature 1
#> 2 10/7/2002 32 6 Immature 1
#> 3 7/18/2000 32 11 Immature 1
#> 4 6/11/2001 32 11 Immature 2
#> 5 8/8/2000 32 13 Immature 2
#> 6 10/4/2003 33 9 Immature 1
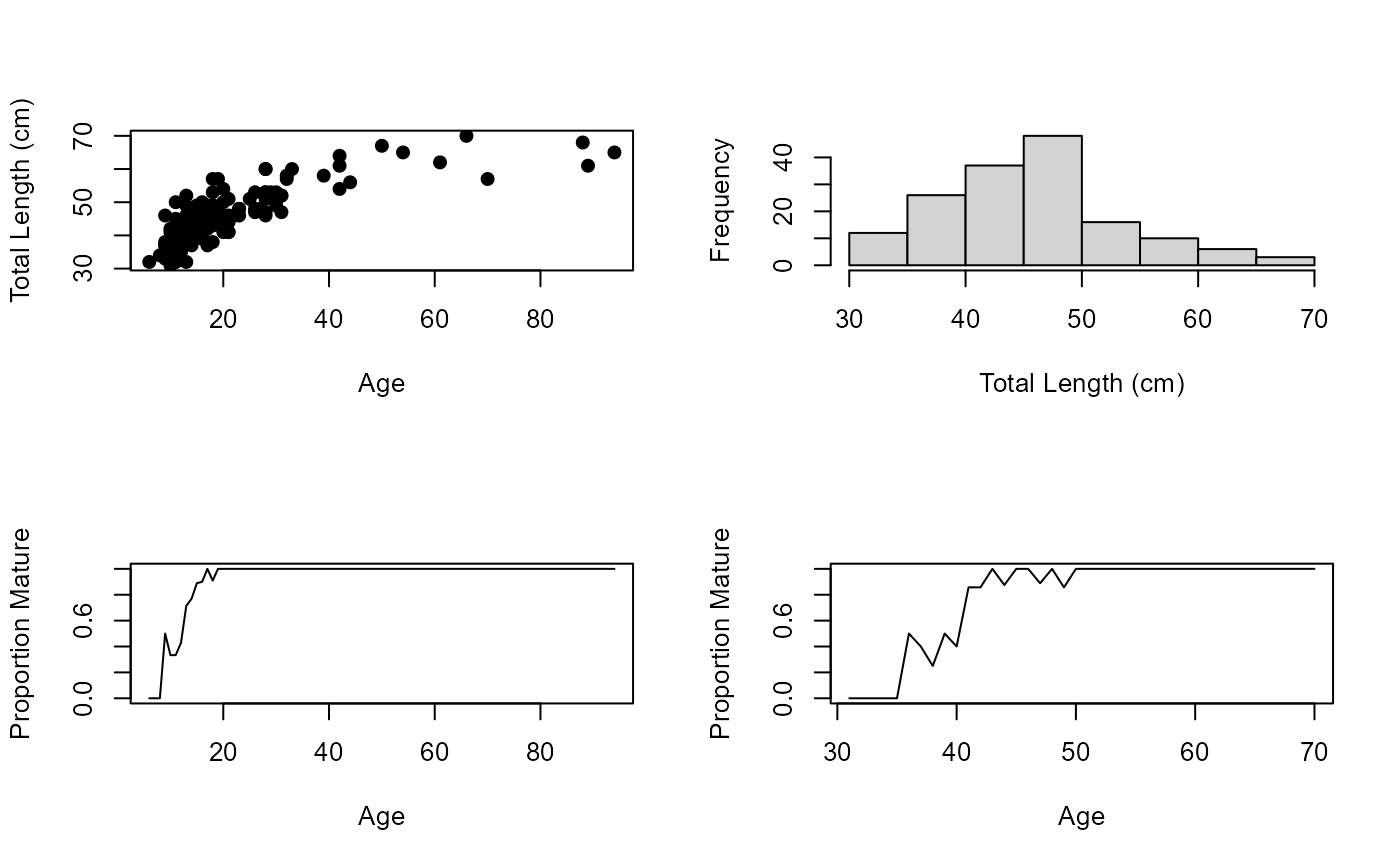
op <- par(mfrow=c(2,2),pch=19)
plot(length~age,data=YERockfish,ylab="Total Length (cm)",xlab="Age")
hist(YERockfish$length,xlab="Total Length (cm)",main="")
tbl1 <- with(YERockfish,table(age,maturity))
(ptbl1 <- prop.table(tbl1,margin=1))
#> maturity
#> age Immature Mature
#> 6 1.00000000 0.00000000
#> 8 1.00000000 0.00000000
#> 9 0.50000000 0.50000000
#> 10 0.66666667 0.33333333
#> 11 0.66666667 0.33333333
#> 12 0.57142857 0.42857143
#> 13 0.28571429 0.71428571
#> 14 0.23076923 0.76923077
#> 15 0.11111111 0.88888889
#> 16 0.10000000 0.90000000
#> 17 0.00000000 1.00000000
#> 18 0.09090909 0.90909091
#> 19 0.00000000 1.00000000
#> 20 0.00000000 1.00000000
#> 21 0.00000000 1.00000000
#> 22 0.00000000 1.00000000
#> 23 0.00000000 1.00000000
#> 25 0.00000000 1.00000000
#> 26 0.00000000 1.00000000
#> 27 0.00000000 1.00000000
#> 28 0.00000000 1.00000000
#> 29 0.00000000 1.00000000
#> 30 0.00000000 1.00000000
#> 31 0.00000000 1.00000000
#> 32 0.00000000 1.00000000
#> 33 0.00000000 1.00000000
#> 39 0.00000000 1.00000000
#> 42 0.00000000 1.00000000
#> 44 0.00000000 1.00000000
#> 50 0.00000000 1.00000000
#> 54 0.00000000 1.00000000
#> 61 0.00000000 1.00000000
#> 66 0.00000000 1.00000000
#> 70 0.00000000 1.00000000
#> 88 0.00000000 1.00000000
#> 89 0.00000000 1.00000000
#> 94 0.00000000 1.00000000
plot(ptbl1[,2]~as.numeric(row.names(ptbl1)),type="l",xlab="Age",ylab="Proportion Mature")
tbl2 <- with(YERockfish,table(length,maturity))
(ptbl2 <- prop.table(tbl2,margin=1))
#> maturity
#> length Immature Mature
#> 31 1.0000000 0.0000000
#> 32 1.0000000 0.0000000
#> 33 1.0000000 0.0000000
#> 34 1.0000000 0.0000000
#> 35 1.0000000 0.0000000
#> 36 0.5000000 0.5000000
#> 37 0.6000000 0.4000000
#> 38 0.7500000 0.2500000
#> 39 0.5000000 0.5000000
#> 40 0.6000000 0.4000000
#> 41 0.1428571 0.8571429
#> 42 0.1428571 0.8571429
#> 43 0.0000000 1.0000000
#> 44 0.1250000 0.8750000
#> 45 0.0000000 1.0000000
#> 46 0.0000000 1.0000000
#> 47 0.1111111 0.8888889
#> 48 0.0000000 1.0000000
#> 49 0.1428571 0.8571429
#> 50 0.0000000 1.0000000
#> 51 0.0000000 1.0000000
#> 52 0.0000000 1.0000000
#> 53 0.0000000 1.0000000
#> 54 0.0000000 1.0000000
#> 56 0.0000000 1.0000000
#> 57 0.0000000 1.0000000
#> 58 0.0000000 1.0000000
#> 60 0.0000000 1.0000000
#> 61 0.0000000 1.0000000
#> 62 0.0000000 1.0000000
#> 64 0.0000000 1.0000000
#> 65 0.0000000 1.0000000
#> 67 0.0000000 1.0000000
#> 68 0.0000000 1.0000000
#> 70 0.0000000 1.0000000
plot(ptbl2[,2]~as.numeric(row.names(ptbl2)),type="l",xlab="Age",ylab="Proportion Mature")
 par(op)