Catch-at-age for Suwanee (Micropterus notius) and Largemouth Bass (Micropterus salmoides) collected from several lakes in Florida, 2001-2002.
Format
A data frame with 39 observations on the following 5 variables.
- species
Species of bass (Suwanee and Largemouth)
- loc
Location (SantaFe, Wacissa, Withlacoochee, Ochlockonee)
- year
Year (2001, 2002)
- num
Number of fish captured
- age
Age of fish at capture
Source
From Figure 2 of Bonvechio, T.F., M.S. Allen, and R.L. Cailteux. 2005. Relative Abundance, Growth, and Mortality of Suwannee Bass in Four Florida Rivers. North American Journal of Fisheries Management 25:275-283. CSV file
Examples
data(BassFL)
str(BassFL)
#> 'data.frame': 39 obs. of 5 variables:
#> $ species: Factor w/ 2 levels "Largemouth","Suwanee": 2 2 2 2 2 2 2 2 2 2 ...
#> $ loc : Factor w/ 4 levels "Ochlockonee",..: 2 2 2 2 2 2 2 2 2 2 ...
#> $ year : int 2001 2001 2001 2001 2001 2002 2002 2002 2002 2002 ...
#> $ num : int 129 28 18 19 3 83 73 37 11 9 ...
#> $ age : int 2 3 4 5 8 2 3 4 5 6 ...
head(BassFL)
#> species loc year num age
#> 1 Suwanee SantaFe 2001 129 2
#> 2 Suwanee SantaFe 2001 28 3
#> 3 Suwanee SantaFe 2001 18 4
#> 4 Suwanee SantaFe 2001 19 5
#> 5 Suwanee SantaFe 2001 3 8
#> 6 Suwanee SantaFe 2002 83 2
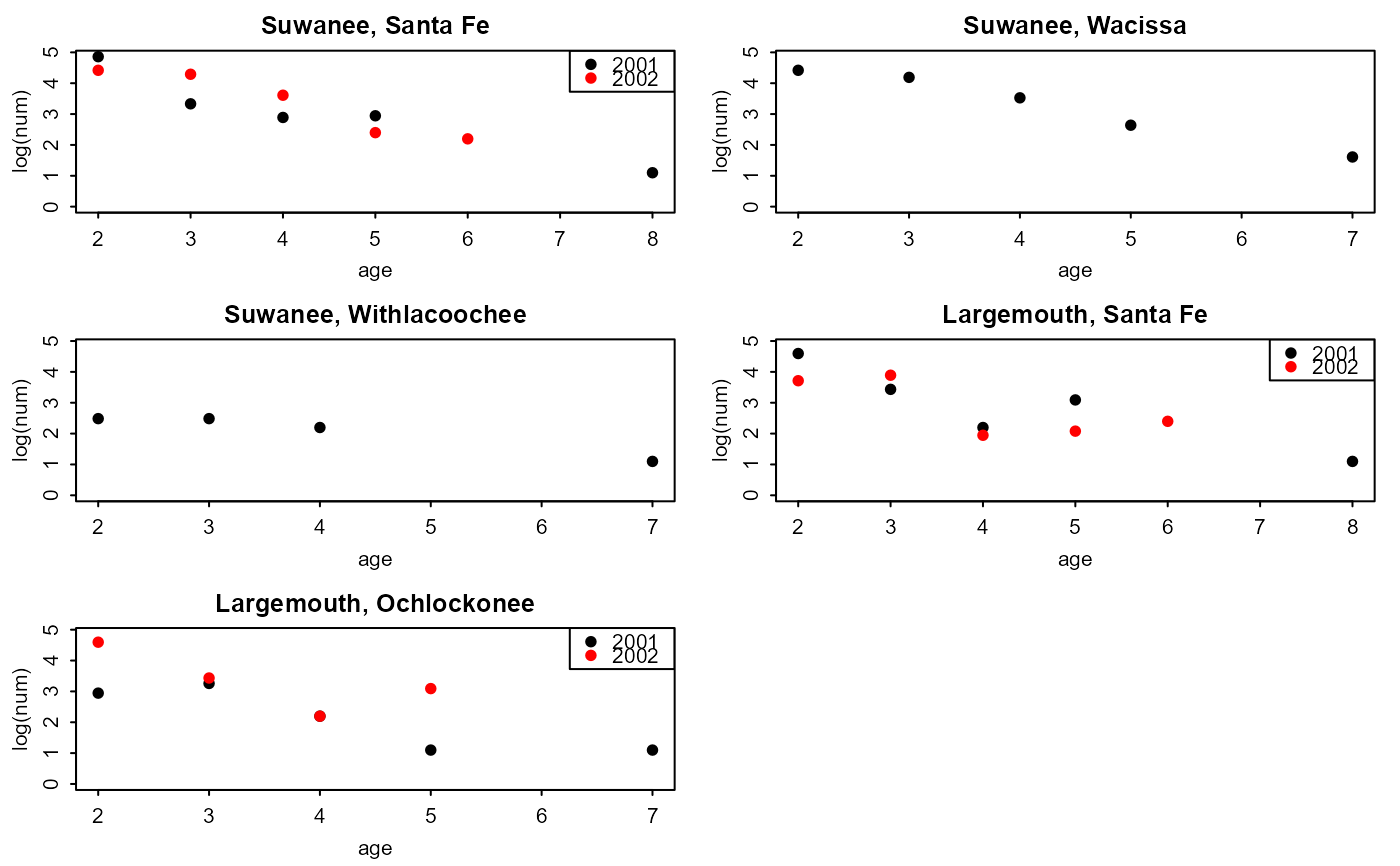
op <- par(mfrow=c(3,2),mar=c(3,3,2,1),mgp=c(1.75,0.5,0),tcl=-0.2,pch=19)
plot(log(num)~age,data=BassFL,subset=(loc=="SantaFe" & year==2001 & species=="Suwanee"),
ylim=c(0,max(log(num))),main="Suwanee, Santa Fe")
points(log(num)~age,data=BassFL,subset=(loc=="SantaFe" & year==2002 & species=="Suwanee"),col="red")
legend("topright",legend=c("2001","2002"),col=c("black","red"),pch=19)
plot(log(num)~age,data=BassFL,subset=loc=="Wacissa" & year==2002 & species=="Suwanee",
ylim=c(0,max(log(num))),main="Suwanee, Wacissa")
plot(log(num)~age,data=BassFL,subset=loc=="Withlacoochee" & year==2002 & species=="Suwanee",
ylim=c(0,max(log(num))),main="Suwanee, Withlacoochee")
plot(log(num)~age,data=BassFL,subset=(loc=="SantaFe" & year==2001 & species=="Largemouth"),
ylim=c(0,max(log(num))),main="Largemouth, Santa Fe")
points(log(num)~age,data=BassFL,subset=(loc=="SantaFe" & year==2002 & species=="Largemouth"),
col="red")
legend("topright",legend=c("2001","2002"),col=c("black","red"),pch=19)
plot(log(num)~age,data=BassFL,subset=loc=="Ochlockonee" & year==2001 & species=="Largemouth",
ylim=c(0,max(log(num))),main="Largemouth, Ochlockonee")
points(log(num)~age,data=BassFL,subset=(loc=="Ochlockonee" & year==2002 & species=="Largemouth"),
col="red")
legend("topright",legend=c("2001","2002"),col=c("black","red"),pch=19)
par(op)