Creates a histogram from values in a frequency table. Primarily used with already summarized length frequency data.
Usage
histFromSum(x, ...)

# Default S3 method
histFromSum(x, y, ...)

# S3 method for class 'table'
histFromSum(x, ...)

# S3 method for class 'formula'
histFromSum(x, data = NULL, ...)
Arguments
- x
A numeric vector of bin/category values, a formula of the form
freq~catwherefreqcontains the count/frequency values andcatcontains the bin/category values, an object of classtablefromtable()orxtabs().- ...
Additional arguments for
hist.- y
A numeric vector of count/frequency values.
- data
A data.frame that contains the
freqandcatvariables if a formula is given inx.
Details
Creates a histogram fro values in a frequency table. The frequency table may be constructed from xtabs, table, or be in the form of a matrix or a data.frame (as if read in from an external data file).
See also
See hist and hist.formula for related functionality.
Author
Derek H. Ogle, DerekOgle51@gmail.com
Examples
## Make some dummy data with a length category variable
set.seed(634434789)
df <- data.frame(tl=round(rnorm(100,100,20)))
df$lcat10 <- lencat(df$tl,w=10)
## Summarize as tables
( tbl1 <- xtabs(~lcat10,data=df) )
#> lcat10
#> 20 50 60 70 80 90 100 110 120 130 140 150
#> 1 1 5 7 10 24 19 19 7 3 3 1
( tbl2 <- table(df$lcat10) )
#>
#> 20 50 60 70 80 90 100 110 120 130 140 150
#> 1 1 5 7 10 24 19 19 7 3 3 1
## Turn the tables into a data.frame for testing (convert
## the categories variables to numeric with fact2num())
df2 <- data.frame(tbl1)
df2$lcat10 <- fact2num(df2$lcat10)
## Turn the table into a matrix for testing
( mat1 <- cbind(lcat10=as.numeric(rownames(tbl1)),freq=tbl1) )
#> lcat10 freq
#> 20 20 1
#> 50 50 1
#> 60 60 5
#> 70 70 7
#> 80 80 10
#> 90 90 24
#> 100 100 19
#> 110 110 19
#> 120 120 7
#> 130 130 3
#> 140 140 3
#> 150 150 1
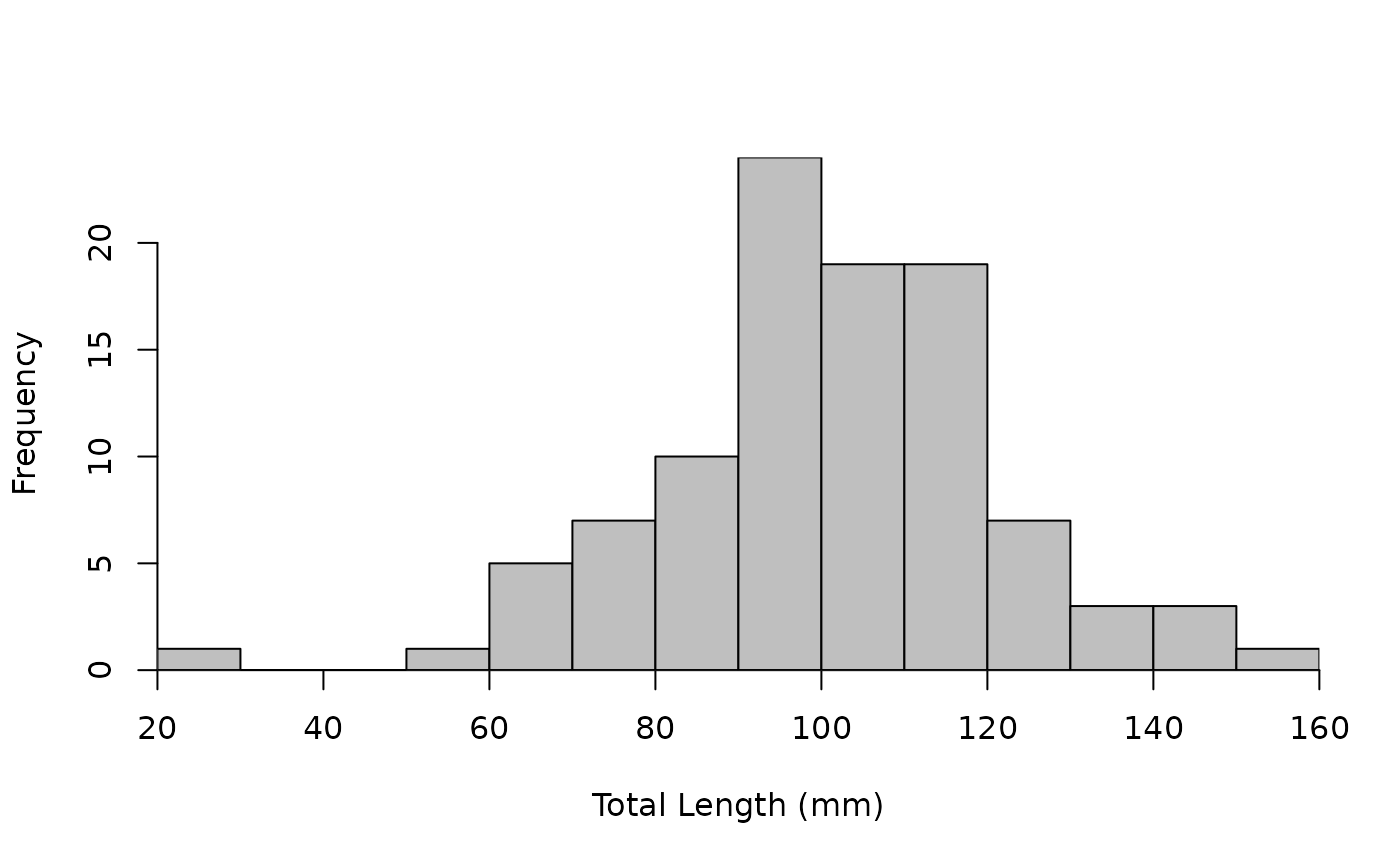
## Histogram of the raw data ... set breaks and x-axis label
brks <- seq(20,160,10)
xlbl <- "Total Length (mm)"
hist(~tl,data=df,breaks=brks,xlab=xlbl)
 ## Use this function with various inputs ... changed colors
## on each plot so that it was obvious that a new plot was made.
# table from xtabs()
histFromSum(tbl1,breaks=brks,xlab=xlbl,col="gray75")
## Use this function with various inputs ... changed colors
## on each plot so that it was obvious that a new plot was made.
# table from xtabs()
histFromSum(tbl1,breaks=brks,xlab=xlbl,col="gray75")
 # table from table()
histFromSum(tbl2,breaks=brks,xlab=xlbl,col="gray70")
# table from table()
histFromSum(tbl2,breaks=brks,xlab=xlbl,col="gray70")
 # vectors from data.frame
histFromSum(df2$lcat10,df2$Freq,breaks=brks,xlab=xlbl,col="gray65")
# vectors from data.frame
histFromSum(df2$lcat10,df2$Freq,breaks=brks,xlab=xlbl,col="gray65")
 # vectors from matrix
histFromSum(mat1[,"lcat10"],mat1[,"freq"],breaks=brks,xlab=xlbl,col="gray60")
# vectors from matrix
histFromSum(mat1[,"lcat10"],mat1[,"freq"],breaks=brks,xlab=xlbl,col="gray60")
 # formula from a data.frame
histFromSum(Freq~lcat10,data=df2,breaks=brks,xlab=xlbl,col="gray55")
# formula from a data.frame
histFromSum(Freq~lcat10,data=df2,breaks=brks,xlab=xlbl,col="gray55")
